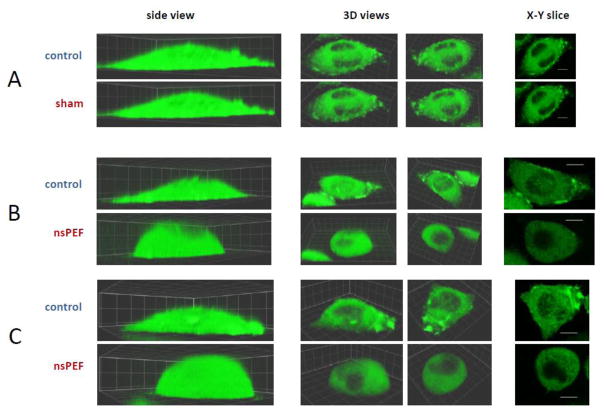
Fig. 3.
Cell reshaping and disassembly of structured actin by nsPEF. A, B, and C are three representative experiments (out of 18). Identical Z-stacks of cell images were taken immediately before exposure (top rows, “control”) and 10 min after it (bottom rows). Cells were exposed to either 0 pulses in A (sham exposure) or 4 pulses at 19.2 kV/cm (600 ns, 2 Hz) in B and C. The side views (left column) are intended to demonstrate cell reshaping by nsPEF. Two different 3D views (center columns) and one X-Y slice (right) were selected to provide the best observation of the structured actin. For each experiment, the control and post-nsPEF images show the same 3D views and the same X-Y slice. For the side and 3D views, the grid size is 5 x 5 μm; for slices, the bar is 10 μm. All experiments were performed in the physiological saline.

