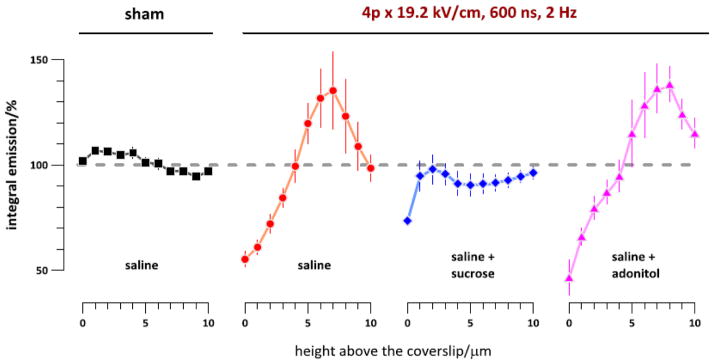
Fig. 5.

Vertical re-distribution of actin fluorescence following sham exposure (left) or nsPEF exposure in different buffers. Z-stacks of cell images were taken with 1-μm step immediately before exposure and 10 min after it. The buffer compositions and exposure parameters are indicated in the graph. Actin fluorescence intensity was integrated over the cell projection area in post-nsPEF images at each height and expressed in % to the respective pre-exposure values. The data were collected from 38 individual cells. See text for more details.
