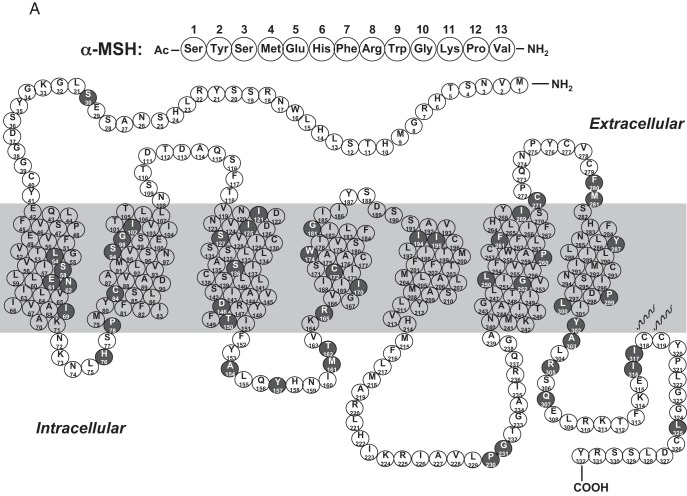
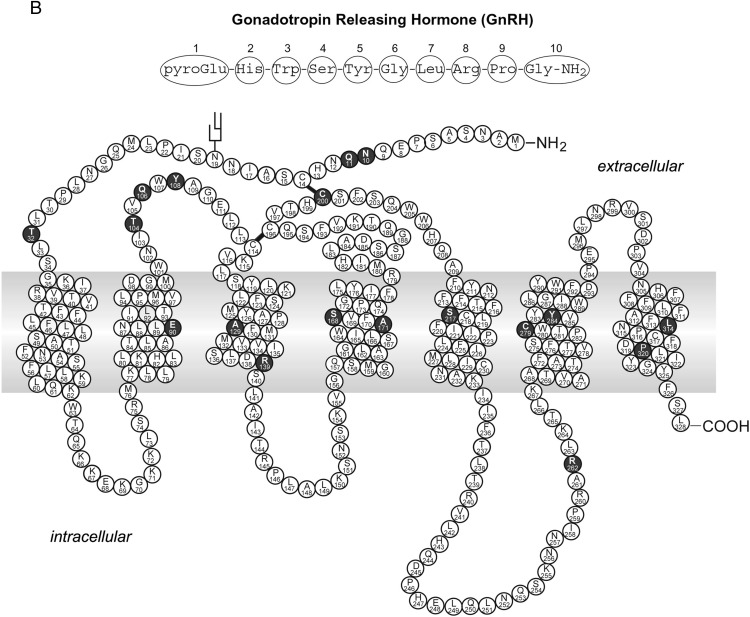
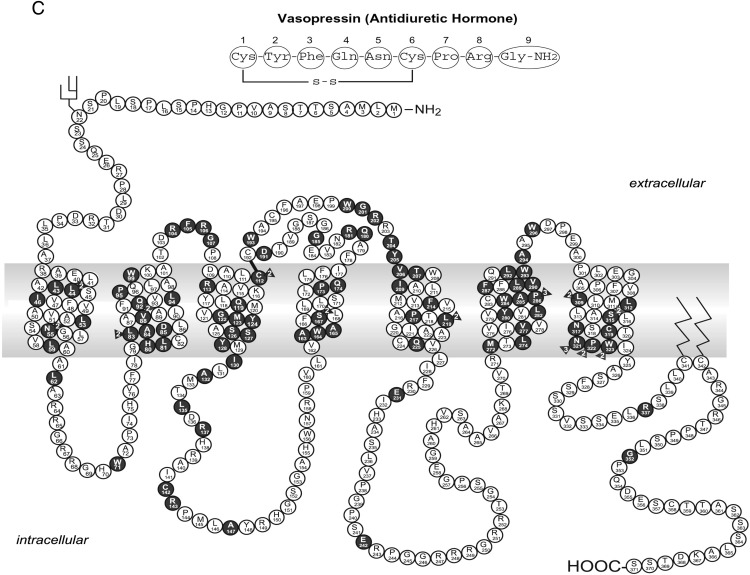
Figure 4.
Schematic representation of Class II mutations in the MC4R (A), GNRHR (B), and AVPR2 (C). Naturally occurring mutations that are defective in cell surface expression are highlighted in dark background. Panel A is based on the tabulation in Ref. 520. Panels B and C are reprinted from P. M. Conn et al: G protein-coupled receptor trafficking in health and disease: lessons learned to prepare for therapeutic mutant rescue in vivo. Pharmacol Rev. 2007;59:225–250 (108), with permission. © American Society for Pharmacology and Experimental Therapeutics.


