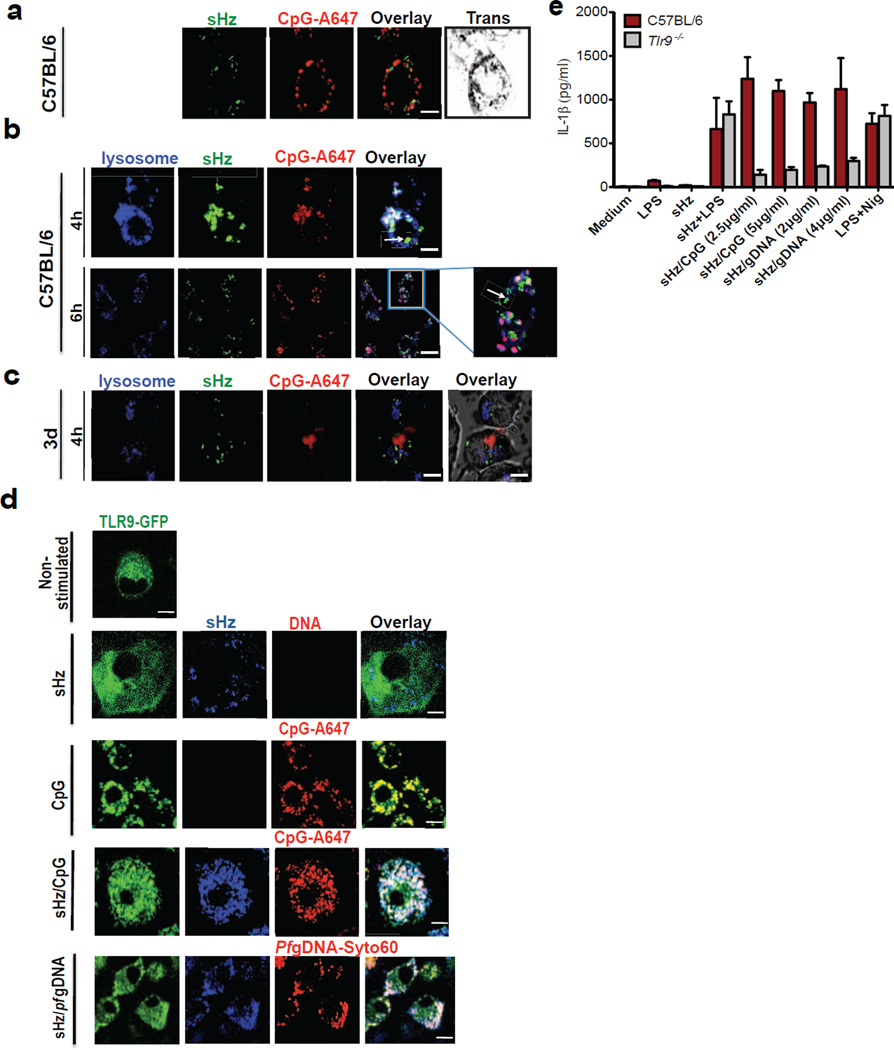
Figure 2. Synthetic Hz/CpG or sHz/Pf gDNA induce TLR9 translocation to the phagosome, followed by TLR9-dependent release of IL-1β.
(a) sHz/CpG-A 647 (5µg/ml) was added to the cells and subjected to confocal microscopy after 6h of incubation. Scale bar: 5µm. (b) BMDMs were incubated with sHz/CpG-A 647 (5µg/ml) × 4h or 6h and stained with LysoTracker (blue). Scale bar: 10µm (top panel) and 5µm (bottom panel). Boxed area in main image at right is enlarged (2.5×); The arrow (in both top and bottom panel) indicates Hz in the cytosol. (c) “3d” macrophages, functionally deficient in TLRs 3,7 and 9, were incubated with CpG-A647 DNA × 4h. Scale bar: 10µm. Fields are representative of at least 10 fields of view and three independent experiments. (d) Immortalized BMDMs isolated from transgenic TLR9-GFP mice were left untreated or incubated with sHz (100µg/ml), CpG-Alexa 647 (5µg/ml), sHz/CpG-Alexa 647 (5µg/ml) and sHz/Pf gDNA-Syto60 (4µg/ml) for 30 min and living cells were visualized by confocal microscopy. Fields are representative of at least 10 fields of view and three independent experiments. Scale bars from top to bottom: 5µm, 15µm, 5µm, 15µm and 5µm. (e) ELISA of IL-1β production by wt and Tlr9−/− BMDMs, primed or unprimed for 2 h with LPS (100ng/ml) and then left unstimulated or stimulated with indicated amounts of sHz, sHz/CpG complex, sHz/Pf gDNA or nigericin (10µM). Supernatants were analyzed for IL-1β 12h after stimulation. Data are presented as mean ± SD of triplicates and are representative of 3 independent experiments. See also Figure S2.

