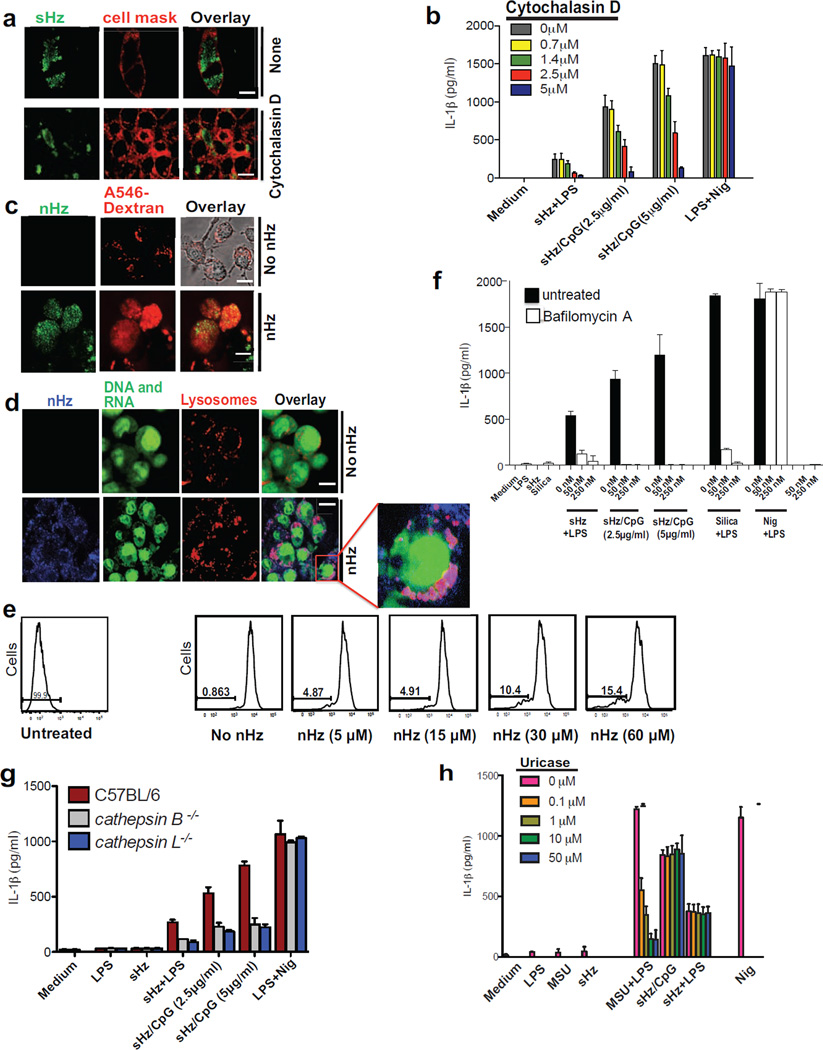
Figure 3. Phagocytosis of crystals leads to phagolysosomal destabilization and is necessary for IL-1β release.
(a) Confocal microscopy of BMDMs stimulated with sHz (100µg/ml) for 2h in the absence and presence of cytochalasin D (2.5 µM). Cell membranes were stained with cell mask (red). Scale bar: 5µm (top) and 20µm (bottom). (b) ELISA of the release of IL-1β into supernatants of immortalized BMDMs left untreated or treated with increasing concentration of cytochalasin D and then stimulated for 12 h with sHz or sHz/CpG complex. (c) Confocal microscopy of immortalized BMDMs incubated with A546-Dextran 10kDa for 45 min and then either left untreated or stimulated with 100µM nHz for 4 h. Scale bar (top and bottom panels: 10µm) (d) Macrophages were stained with acridine orange (0.05 mg/ml) for 10 min and then stimulated with nHz (100µM). 4h after stimulation, cells were analyzed by confocal microscopy. Fields are representative of at least 10 fields of view and three independent experiments. Scale bar: 10µm (top) and 20µm (bottom). Boxed area is enlarged (9×). (e) FACS analysis of immortalized BMDMs stained with acridine orange and treated with indicated amounts of nHz × 4h. The numbers above the brackets indicate the % macrophages that have lost acridine orange staining. (f) ELISA of released IL-1β from unprimed or LPS-primed immortalized BMDMs pretreated with indicated concentrations of bafilomycin A × 2 h and then stimulated with sHz, sHz/CpG or Silica (500µg/ml) × 12 h. (g) ELISA of released IL-1β by wt, ctsb−/− and ctsl−/− BMDMs left unstimulated or stimulated with sHz (100µg/ml) or sHz/CpG for 12 h. (h) ELISA of IL-1β production by unprimed or LPS-primed immortalized murine BMDMs pretreated with indicated concentrations of Uricase for 2 h, stimulated with LPS (100ng/ml) for another 2 h and then incubated with MSU (500µg/ml), sHz (100µg/ml) and sHz/CpG (5µg/ml) for 12 h. Data are presented as mean ± SD of triplicates and are representative of 3 independent experiments. See also Fig. S3.

