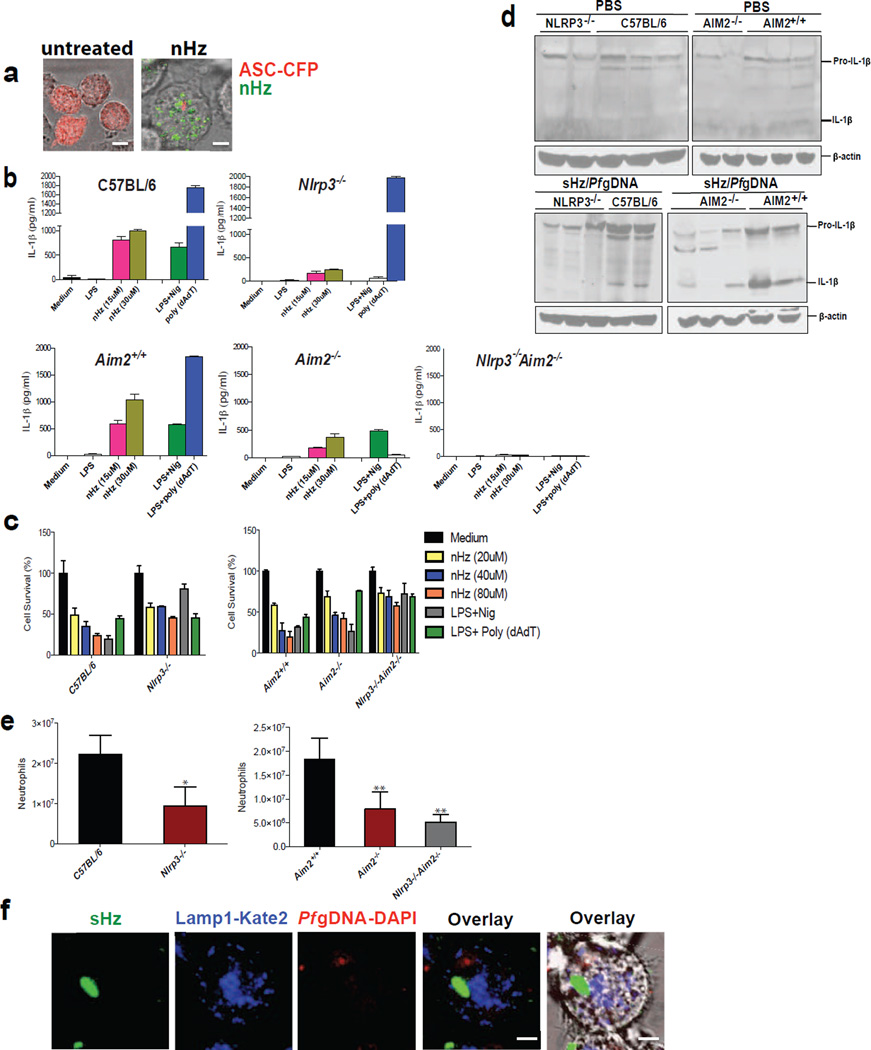
Figure 5. nHz and sHz/Pf gDNA complex induce IL-1β production and pyroptosis both in vitro and in vivo via NLRP3 and AIM2.
(a) Macrophages stably expressing ASC-CFP were left untreated or treated with nHz (100µM). The formation of ASC pyroptosomes was visualized using confocal microscopy. Scale bar: 15µm (left) and 5µm (right) (b) Primary wt, Nlrp3−/−, Aim2+/+, Aim2−/− and Nlrp3−/−, Aim2−/− BMDMs were incubated for 12 h with 15 µM and 30 µM of nHz, nigericin (10µM) or transfected with 1.5µg/ml poly (dAdT) using Lipofectamine. Cell culture supernatants were assessed for IL-1β release by ELISA (c) Primary wt, Nlrp3−/−, Aim2+/+, Aim2−/−, and Nlrp3−/−, Aim2−/− BMDMs were incubated for 12 h with 20 µM, 40 µM and 80 µM of nHz or transfected with Poly (dAdT). Cell survival was measured using calcein AM. Medium was set as 100%. Data are mean cytokine levels ± SD of triplicate determinations and are representative of 3 independent experiments (d) wt, Nlrp3−/−, Aim2+/+, Aim2−/− and Nlrp3−/−Aim2−/− mice were i.v. injected in the tail vein with endotoxin-free PBS or sHz/Pf gDNA (1mg sHz, 15µg Pf gDNA). After 12 h livers were dissected and homogenized. Each lane corresponds to one mouse. (e) wt (n=12), Nlrp3−/− (n=16), Aim2+/+(n=9), Aim2−/− (n=14), and Nlrp3−/− Aim2−/− (n=6) mice were intraperitonally injected with sHz/Pf gDNA (1mg sHz, 15µg Pf gDNA) or PBS. After 15 h, peritoneal cells were harvested, counted and FACS analysis was performed using GR-1 antibody. Basal neutrophil influx in PBS injected mice was subtracted to determine total number of neutrophils recruited to the peritoneal cavity. Student’s t-test was used to calculate P values (*p<0.05, **p<0.001). (f) Pf gDNA (5µg/ml) was DAPI stained for 30 min and used to make sHz/Pf gDNA. Lamp1-Kate2 macrophages were then stimulated with sHz/Pf gDNA for 2 h and subjected to reflection confocal microscopy. Fields are representative of at least 10 fields of view and three independent experiments. Scale bar: 5µm. See also Fig. S5.

