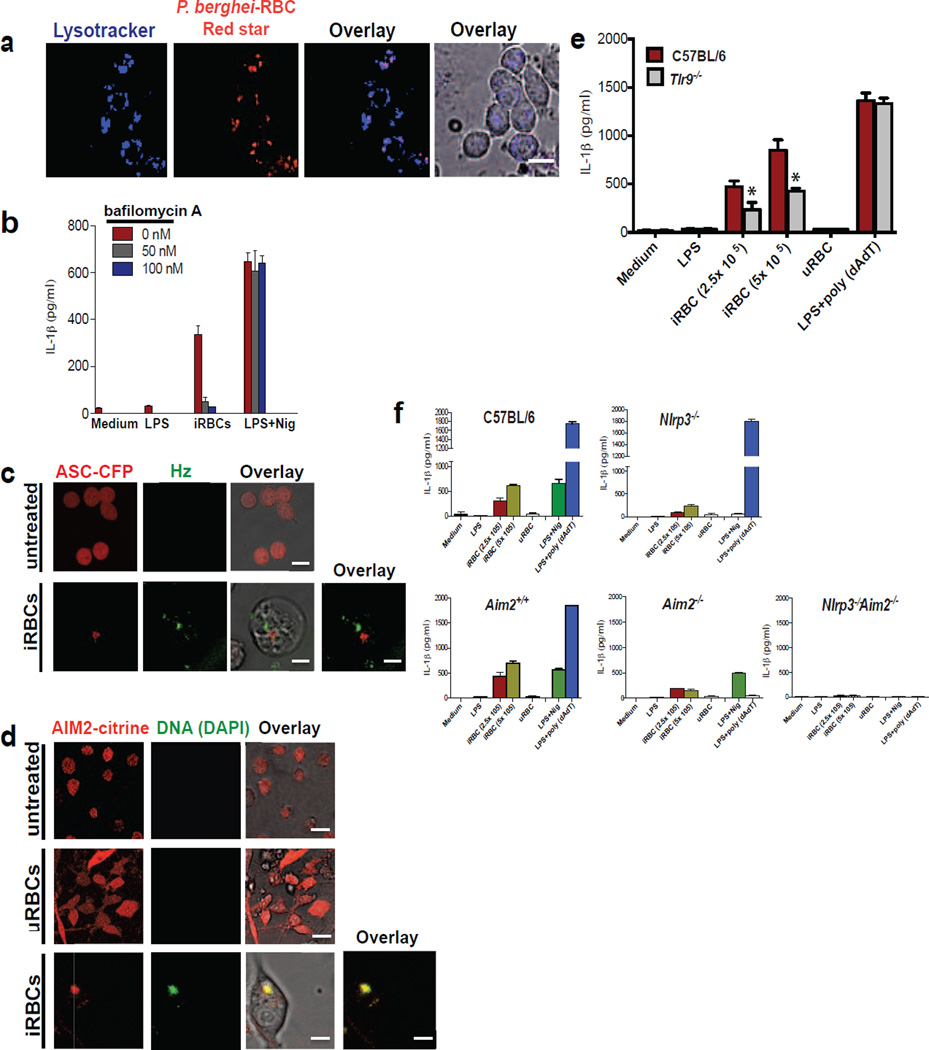
Figure 6. P. berghei-RBCs induced IL-1β production is NLRP3 and AIM2 dependent.
(a) Confocal imaging of immortalized BMDMs incubated with 8× 10⁵ P. berghei (NK65) Red star for 2 h. Lysosomes were stained with lysotracker (blue). Scale bar: 20µm (b) ELISA of the release of IL-1β from immortalized BMDMs pretreated with indicated concentrations of bafilomycin A for 2 h and then incubated with 8× 10⁵ P. berghei-RBCs for 12 h (c) ASC-CFP macrophages were incubated with 8× 10⁵ P. berghei-RBCs for 12 h and imaged by confocal microscopy. Natural Hz was visualized using reflection microscopy (green). Scale bar: 20µm (top) and 5µm (bottom) (d) P. berghei-RBCs (iRBCs) and uninfected (uRBCs) were incubated with DAPI for 1h and then co-cultured with AIM2-citrine macrophages for 2 h. Fields are representative of at least 10 fields of view and three independent experiments. Scale bar: 20µm (top), 20µm (middle) and 5µm (bottom) (e) Wt and Tlr9−/− BMDMs were incubated with 2.5×10⁵ and 5×10⁵ P. berghei-infected RBCs, 5×10⁵ uRBCs, or transfected with poly (dAdT) using Lipofectamine for 12 h. The supernatants were subjected to ELISA for IL-1β. *P<0.05, (Student’s t-test) (f) Primary wt, NLRP3−/−, AIM2+/+, AIM2−/− and NLRP3−/−, AIM2−/− BMDMs were incubated with 2.5×10⁵ and 5×10⁵ P. berghei-RBCs, 5×10⁵ uRBCs for 12 h or transfected with poly (dAdT) using Lipofectamine. The supernatants were subjected to ELISA for IL-1β. Infected RBCs used for all experiments above were taken at day 14 from C57BL/6 mice infected with P. berghei NK65. Data are presented as the mean of triplicate determinations ± SD and are representative of 3 independent experiments. See also Fig. S6.

