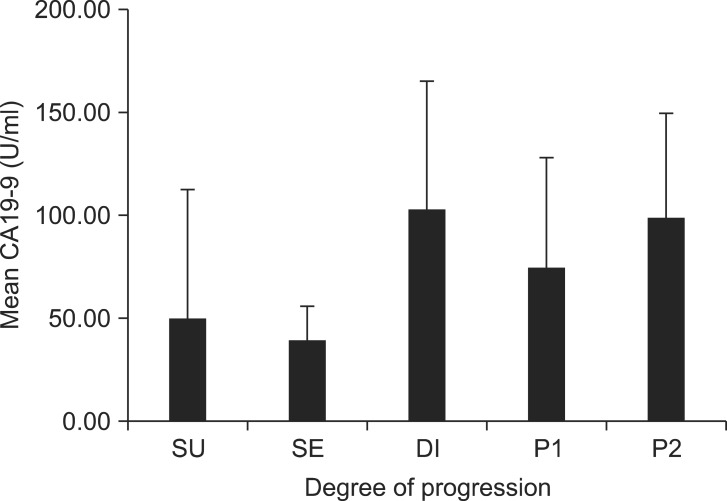
Fig. 3.
Comparison of the mean CA19-9 levels among the five groups. The DI and P2 groups had significantly higher CA19-9 values (DI, 101.67±193.2 U/ml, P=0.025; P2, 98.57±212.4 U/ml, P=0.007). Error bar is ±2 standard error. CA19-9 = carbohydrate antigen 19-9; SU = serosa-unexposed; SE = serosa-exposed; DI = direct invasion; P1 = localized seeding; P2 = extensive seeding.

