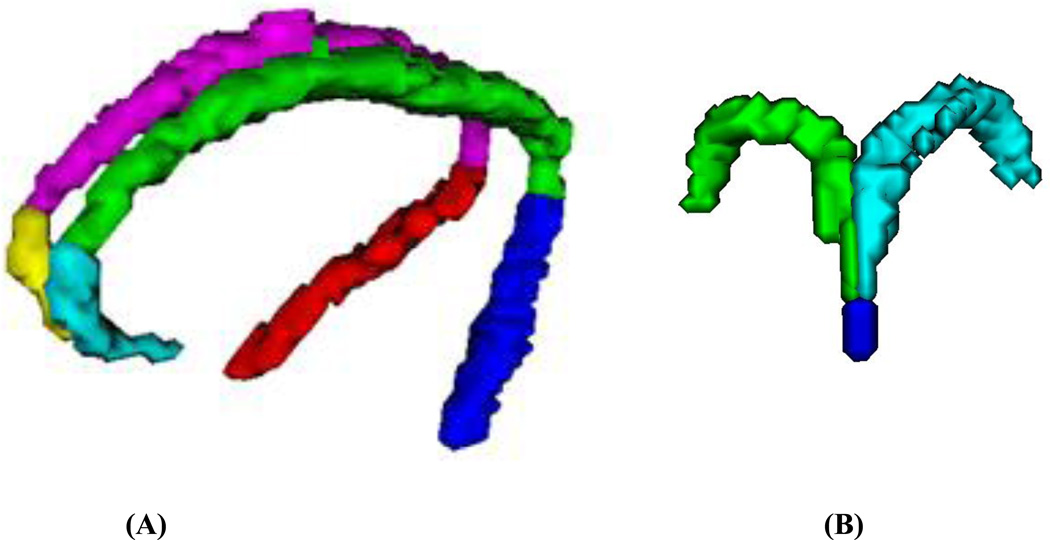
Figure 1. Segmentation of cingulum and fornix and their subregions.
(A): Three dimensional visualization of the segmented cingulum subregions of posteroinferior right (red) and left (blue), superior right (magenta) and left (green), and the anteroinferior right (yellow) and left (cyan).
(B): Three dimensional visualization of the segmented fornix subregions of body (blue), right crus (green) and left crus (cyan) for the same patient.

