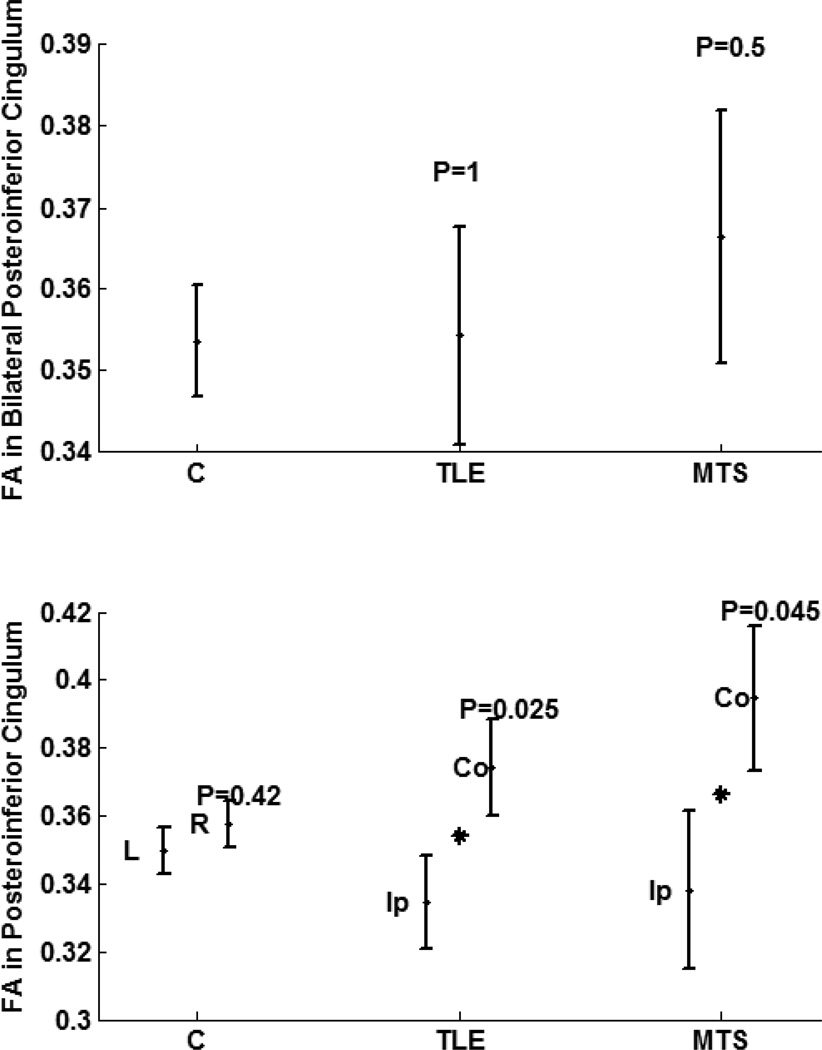
Figure 3. Comparing FA in posteroinferior cingulum of cohorts of nonepileptic subjects, TLE patients, and the subset of TLE patients with pathology proven MTS.
Top: Bilateral variations. Bottom: Hemispheric variation between left and right hemispheres for nonepileptic subjects, and between structures ipsilateral and contralateral sides to the epileptogenicity. Stars indicate statistical significance and P indicate the significance p-value.
Figure notation: FA, fractional anisotropy; L, left, R, right; Ip, ipsilateral; Co, contralateral.

