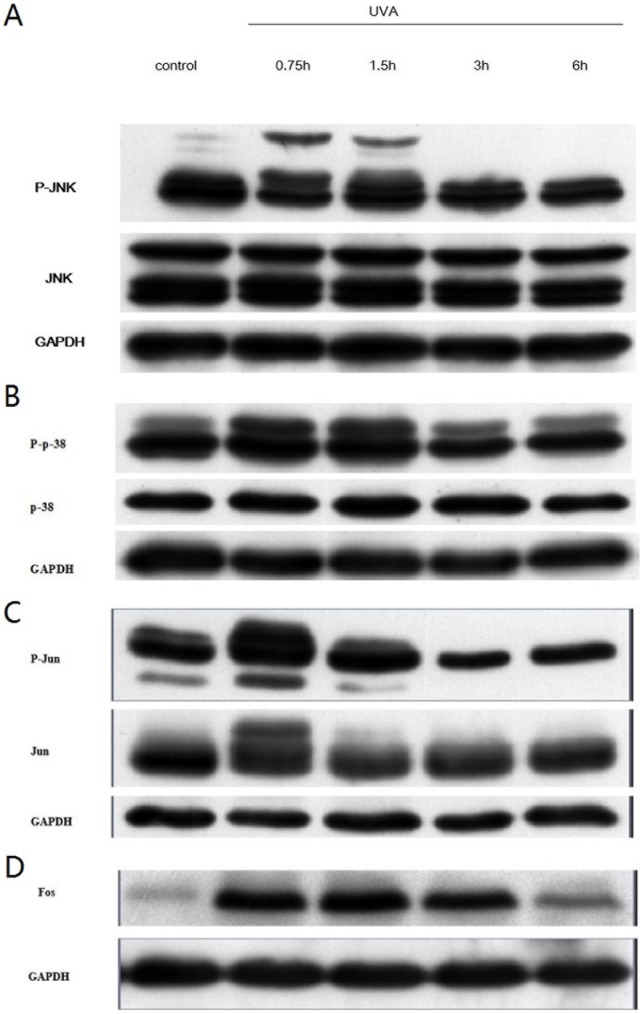
Figure 3. Time courses for UVA-induced MAPK activation and AP-1 activity.
Cells were mock-irradiated or irradiated with 10 J/cm2 UVA and harvested at the indicated time points. Western blot analysis was performed and the representative data of three independent experiments were shown. Figure showed the expression of (A) JNK; (B) p38; (C) Jun; (D) Fos.

