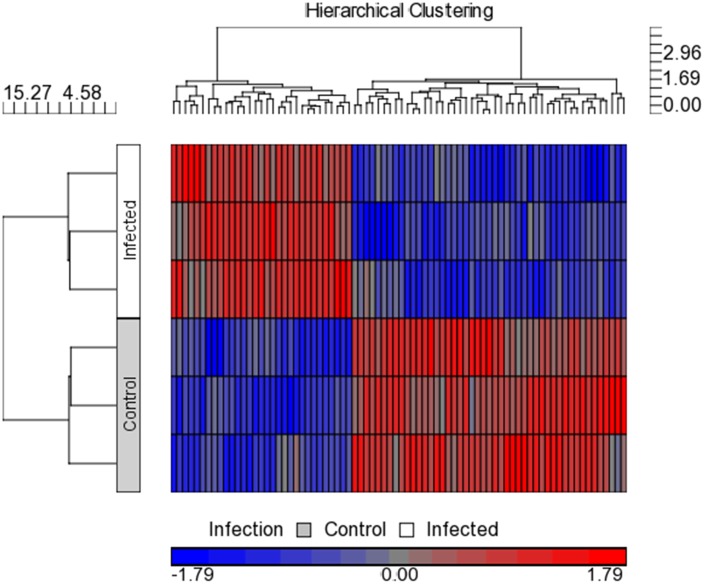
Figure 4. Heat map of the microarray miRNA expression profile of EV71 infected and non-infected control colorectal cells, HT29.
The two-way hierarchical cluster heat map showed differential expressed miRNAs of two groups of samples. The miRNAs were chosen according to the cut off p<0.05 where blue represents miRNAs with decreased expression and red represent miRNAs with increased expression. (n = 3, * = p values of <0.05).

