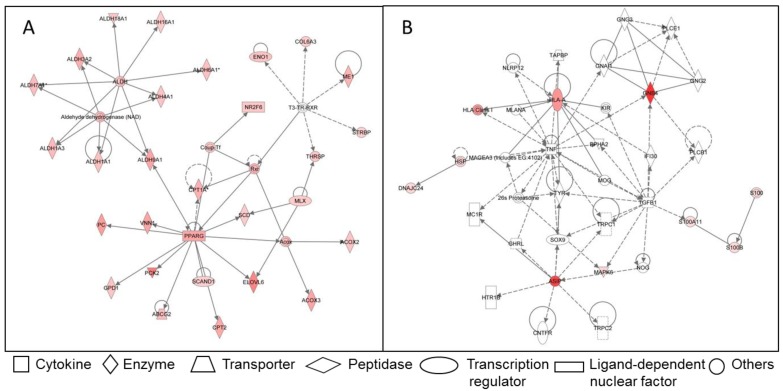
Figure 2.
Examples for networks of differently regulated genes in the functional category “lipid metabolism” in adipose tissue of Japanese Black and Holstein cattle. (A) Network of genes up-regulated in SAT compared to IMF regardless of breed. Only genes without breed differences were included. (B) Network of genes up-regulated in IMF of Japanese Black compared to IMF of Holstein cattle. Up-regulated genes are marked reddish/red. Solid lines indicate direct interaction between genes, dashed lines stand for indirect interactions 68.

