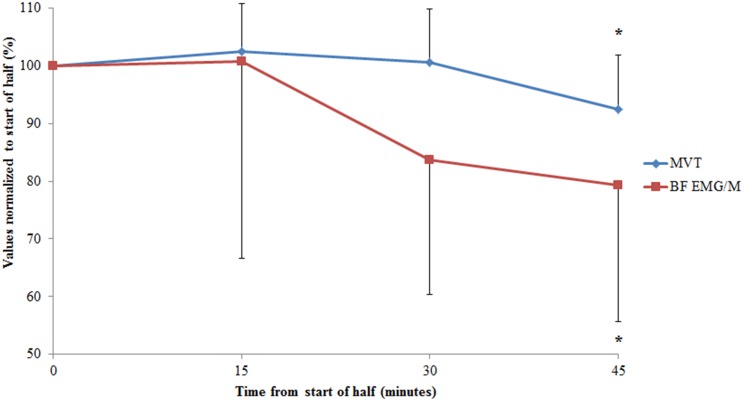
Figure 3. Changes in hamstring maximal voluntary torque (MVT) and biceps femoris (BF) EMG/M values, collapsed across each half at the different time points.
Absolute data for each variable (MVT and EMG/M) are normalized to the value recorded before the start of each half. *indicates a significant reduction from the start of the half (p<0.05). Data are mean and SD.

