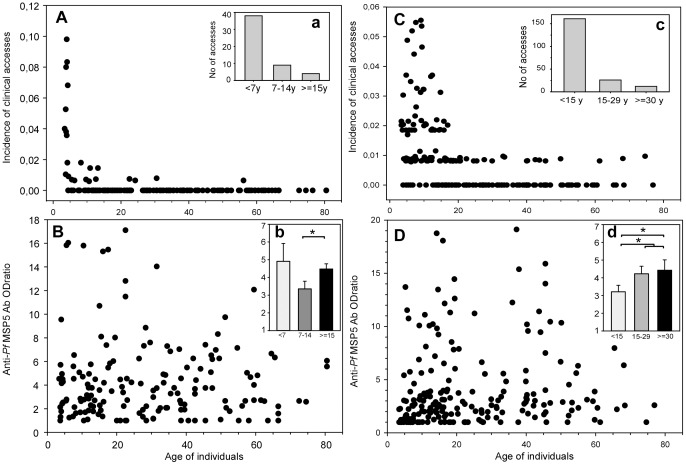
Figure 1. Age-related distribution of clinical episodes and IgG responses to PfMSP5.
Distribution of clinical episodes and ELISA OD ratios reflecting IgG responses to PfMSP5 are plotted according to the age of individuals in Dielmo (A and B) and in Ndiop (C and D) in 2002. In captions are shown age-group distribution of number of clinical episodes in Dielmo (a) and Ndiop (c) and mean ODratio of anti-MSP5 IgG responses in Dielmo (b) and Ndiop (d). Groups were based on distribution of parasitologic and clinical data defined for both populations ie the <7, 7–14 and >15 y age-groups in Dielmo, and for the <15, 15–29 and >30 y age-groups in Ndiop. Brackets and asterisk indicate significant age-related differences (P<0.05) between levels of Ab responses.

