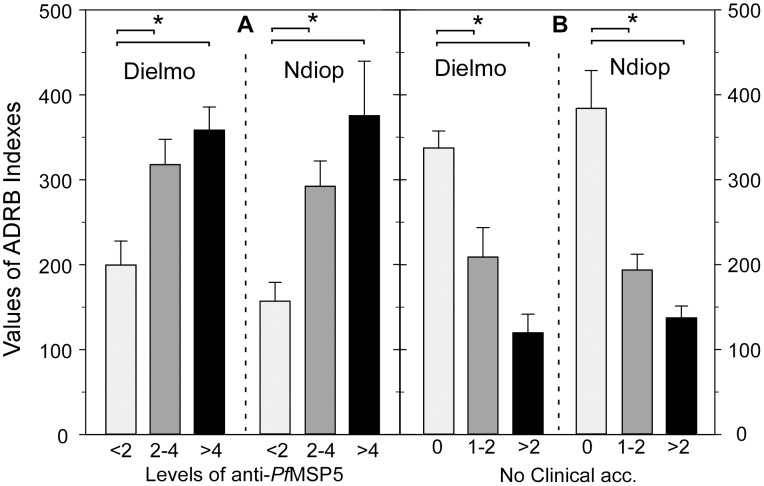
Figure 4. Relationship between ADRB functional antibody responses and anti-PfMSP5 IgG responses or malaria episodes.
ADRB indexes were determined for 236 sera (120 for Dielmo-2002, 116 for Ndiop-2002) as described in Methods and compared (A) between individuals stratified by anti-PfMSP5 responses and (B) between individuals stratified by clinical outcome. In A, anti-PfMSP5 responses expressed as OD ratios <2 for negative (light grey bars), 2–4 for moderate (dark grey bars) and >4 for strong (black bars). In B, mean ADRB values are plotted by stratified clinical outcome: no (light grey), one or two (dark grey) and more than 2 clinical malaria episodes (black) during the 5.5 month follow up. Bracket and asterisks indicate significant differences (P<0.05).

