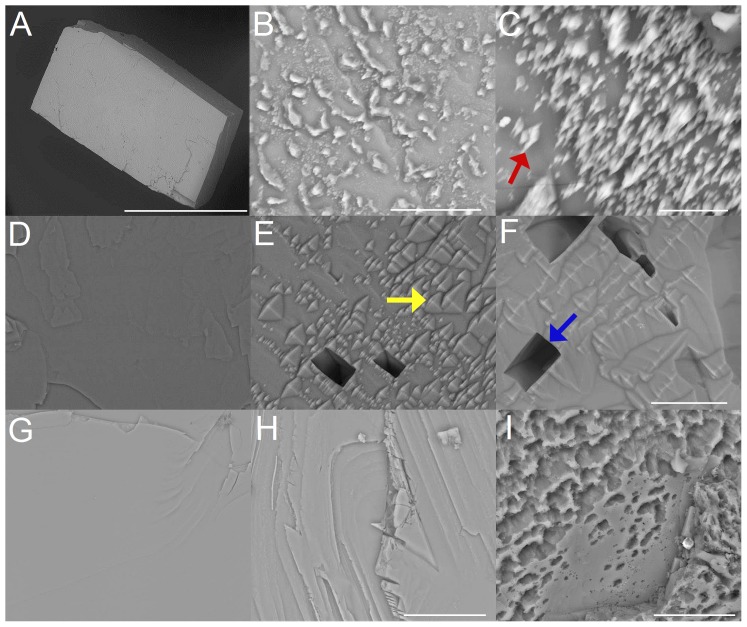
Figure 2. Rhombohedral faces of a calcite single crystals after exposure to hydrochloric acid (pH = 1) (A,B,C), EDTA (c = 0,107 mol/L) (D,E,F) and completely purified water (G,H,I).
(A) Calcite crystal before exposure. Time-dependent crystal surface changes after 120 min (B) and 180 min (C) treatment with hydrochloric acid. The red arrow in (C) shows dissolution induced spike like surface structures. (D) Crystal surface before EDTA exposure, after 60 min (E) and 180 min (F) EDTA-treatment. The yellow arrow in (E) marks pyramidal etch structures, the blue arrow in (F) shows a larger hole characterized by straight edges. (G) Calcite crystal before exposure, after 2.5 hours (H) and 27.5 hours (I) treatment with completely purified water. ESEM, low vacuum (LV), 15 kV. Scale bars (A): 2 mm, (B): 10 µm, (C): 5 µm, (F) also for (D,E): 20 µm, (H) also for (G): 20 µm and (I): 10 µm.

