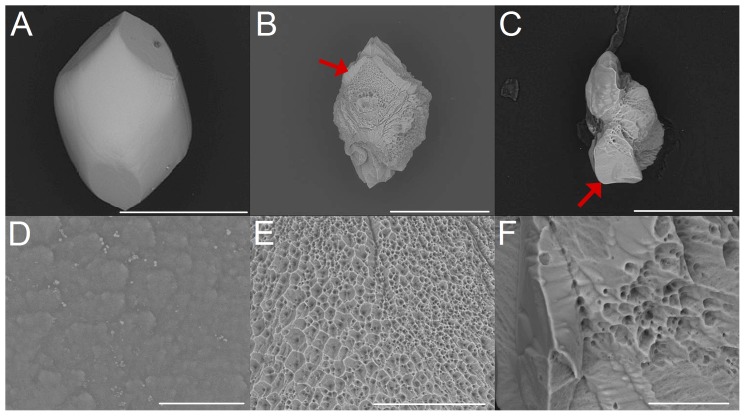
Figure 4. Dissolution of artificial otoconia after treatment with EDTA (c = 0,107 mol/L) (A,B,C) and details of the dissolution effects (belly-area) (D,E,F).
(A) Single otoconium before exposure to EDTA. Dissolution after 90 min (B) and 160 min (F) exposure. (D) Surface structure before EDTA treatment and after 30 min (E) and 140 min (F) exposure. The red arrows in (B) and (C) indicate one of the branches of the otoconium. ESEM, low vacuum (LV), 15 kV. Scale bars (A): 400 µm, (B): 200 µm, (C): 100 µm, (D): 10 µm, (E): 50 µm, (F): 20 µm.

