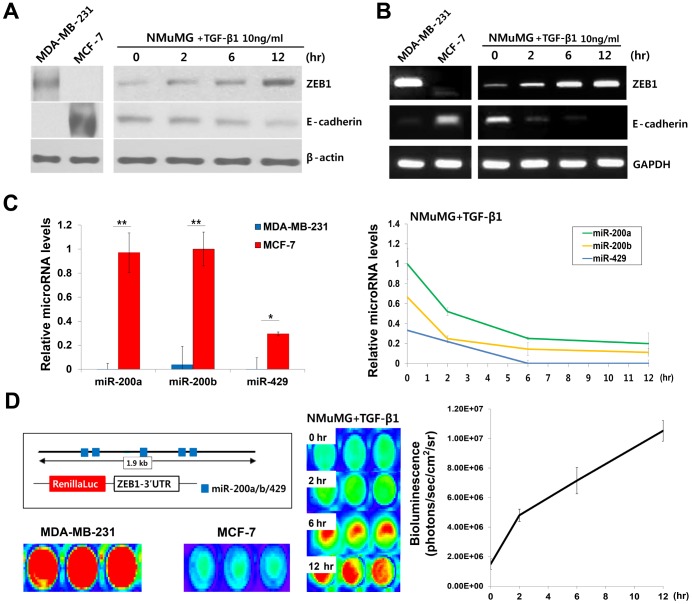
Figure 2. Reciprocal expression of E-cadherin, ZEB1, and the miR-200 family during EMT.
(A, B) Western blot and RT-PCR analyses of ZEB1 and E-cadherin in MCF-7, MDA-MB-231, and TGF-β1 treated NMuMG cells. (C) Real-time PCR analysis of the miR-200 family. The levels of miR-200a, b, and 429 in MCF-7, MDA-MB-231, and TGF-β1 treated NMuMG cells were evaluated. *, ** indicates p<0.05 or p<0.01, respectively. (D) A schematic image of the Renilla luciferase reporter and the analysis of luminescence signals for evaluating the binding availability of miR-200a-MBs. After transfection of pRL-ZEB1 plasmid, the luminescence signals in MCF-7, MDA-MB-231, and TGF-β1 treated NMuMG cells were analyzed. Data are from three independent experiments.

