
Fig 1.
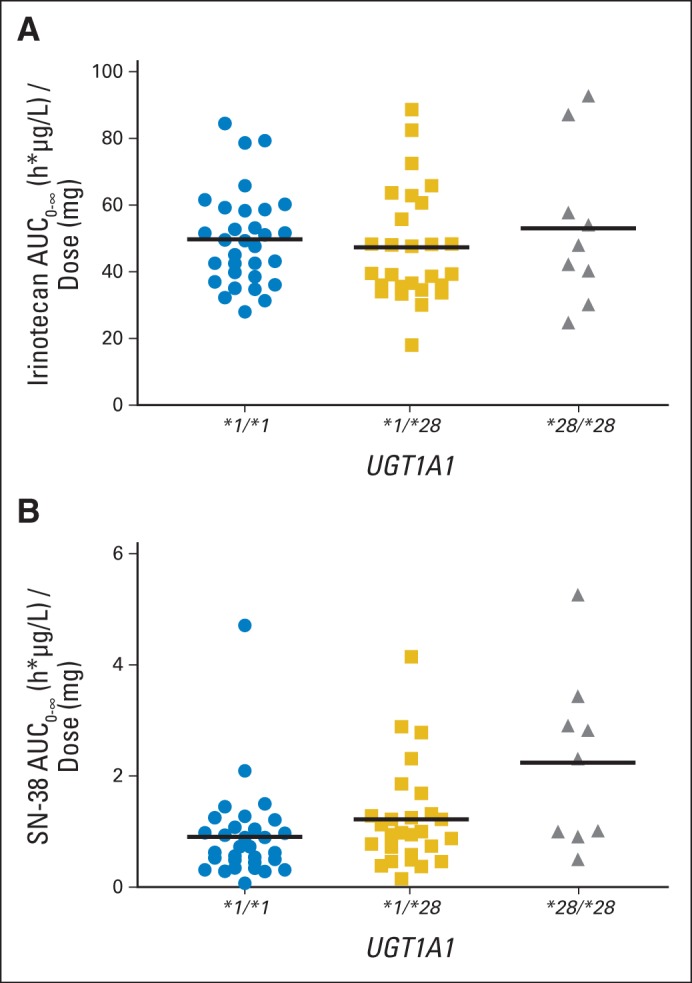
Relationship between the UGT1A1*28 genotype and dose-adjusted areas under the curve (AUCs) of irinotecan (A; P = .62) and SN-38 (B; P = .01). Horizontal bars represent the means.
Official websites use .gov
A
.gov website belongs to an official
government organization in the United States.
Secure .gov websites use HTTPS
A lock (
) or https:// means you've safely
connected to the .gov website. Share sensitive
information only on official, secure websites.
Relationship between the UGT1A1*28 genotype and dose-adjusted areas under the curve (AUCs) of irinotecan (A; P = .62) and SN-38 (B; P = .01). Horizontal bars represent the means.