
Fig 1.
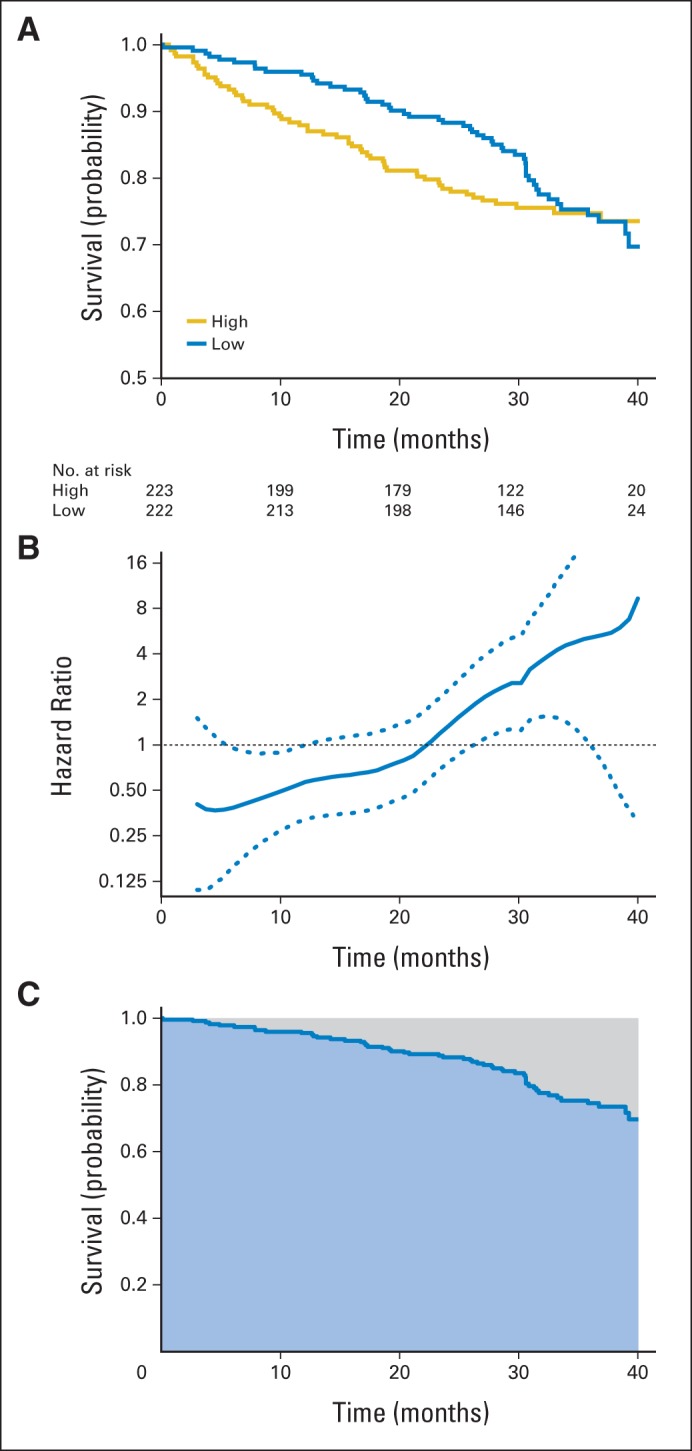
Estimated survival curves, hazard ratio, and restricted mean survival times with data from the Eastern Cooperative Oncology Group E4A03 study. (A) Kaplan-Meier curves for low-dose (blue) and high-dose (gold) groups. (B) Estimate of the ratio of hazard functions (low dose over high dose) over time and corresponding 0.95 point-wise confidence band. (C) Estimate of restricted mean survival time (blue area) and the restricted mean time lost (gray area) up to 40 months for the low-dose group.