
Figure 4. The concentrations of cystatin C, nephrin and adiponectinin plasma of rats treated with saline (C); saline + swimming exercise (C + swim); adenine (A); A + swim; gum acacia (GA); GA + swim; A + GA; and A + G + swim.
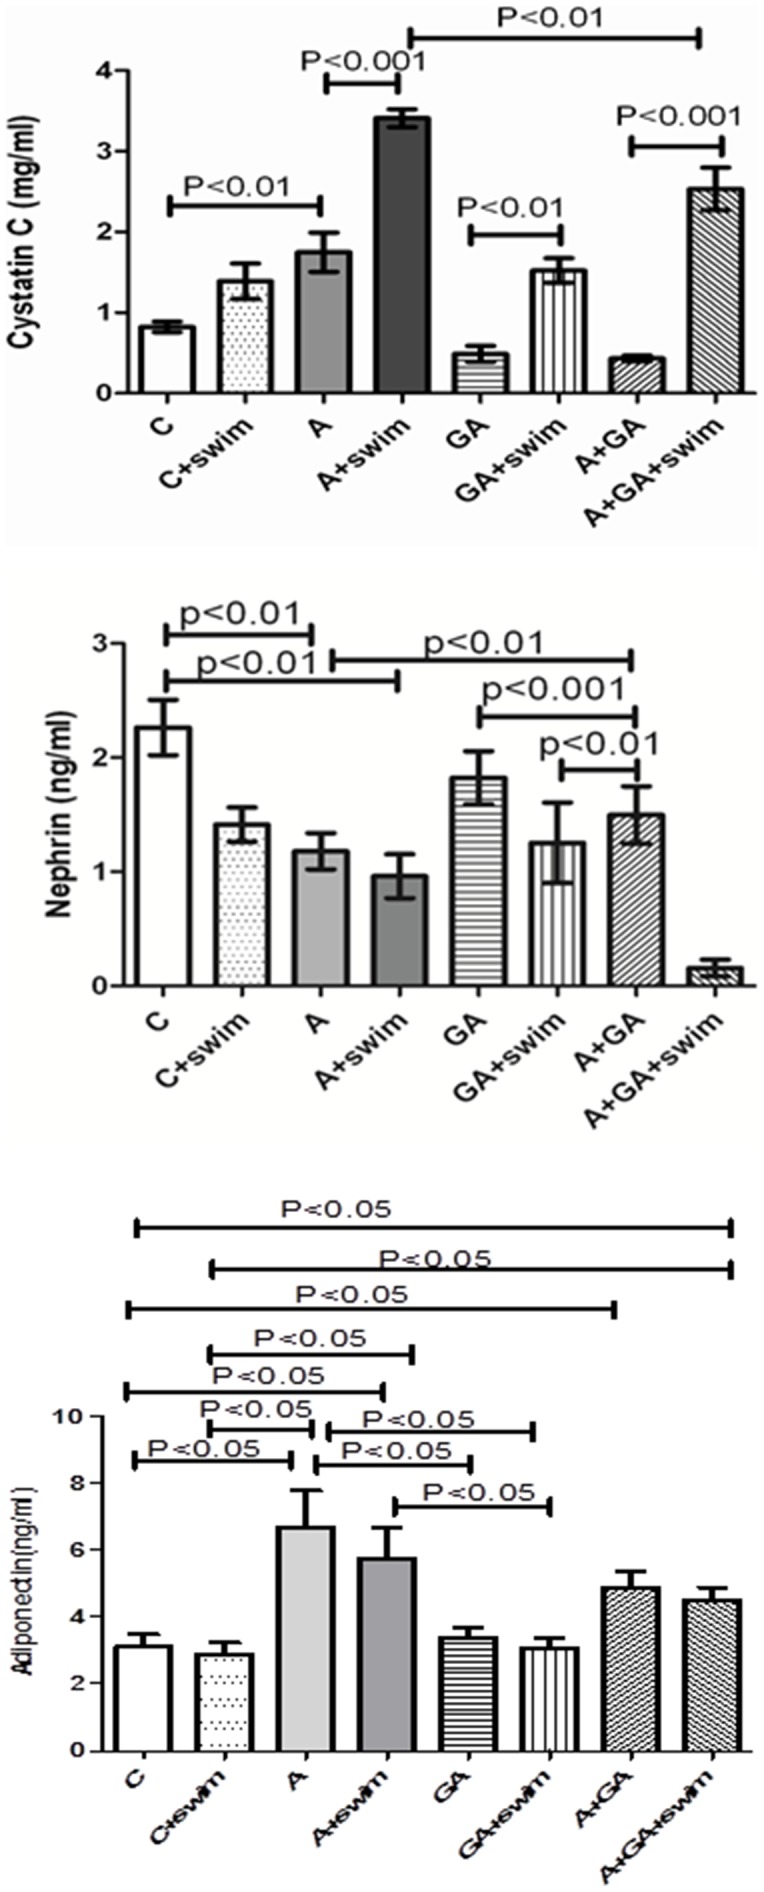
Each column is mean ± SEM (n = six rats). Statistical analysis by ANOVA followed by Newman–Keuls test.