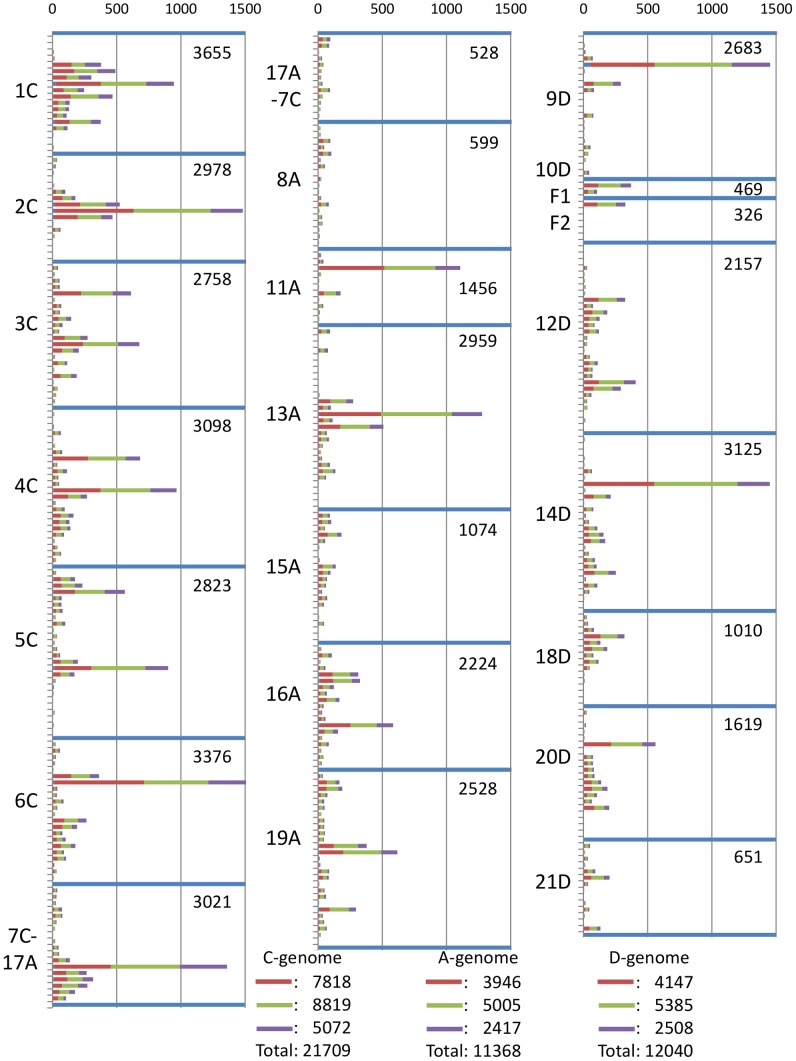
Figure 3. Distribution of GBS loci across the oat genome.
Maps of each chromosome (delineated by blue lines and labeled on left) are divided into 5 cM bins with 0 cM starting at the top. Red bars show numbers of loci detected by two pipelines, green shows those detected only by the population-filtering pipeline, and violet shows those detected only by the UNEAK pipeline. Numerals inside boxes show total GBS loci by chromosome. A summary of placed GBS loci by pipeline and by sub-genome is shown.

