. 2014 Jul 10;14:24. doi: 10.1186/1471-2342-14-24
Copyright © 2014 Kalderstam et al.; licensee BioMed Central Ltd.
This is an Open Access article distributed under the terms of the Creative Commons Attribution License (http://creativecommons.org/licenses/by/4.0), which permits unrestricted use, distribution, and reproduction in any medium, provided the original work is properly credited. The Creative Commons Public Domain Dedication waiver (http://creativecommons.org/publicdomain/zero/1.0/) applies to the data made available in this article, unless otherwise stated.
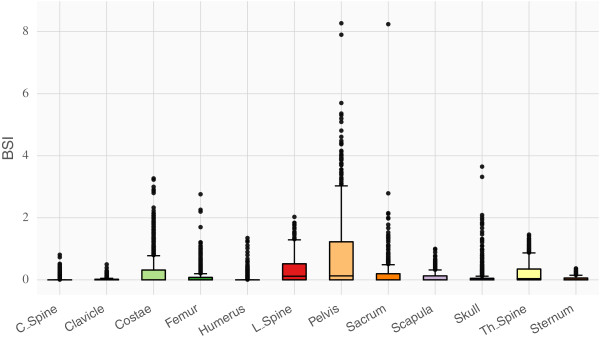
Figure 2.

The distribution of BSI values in the different regions presented as box plots.
