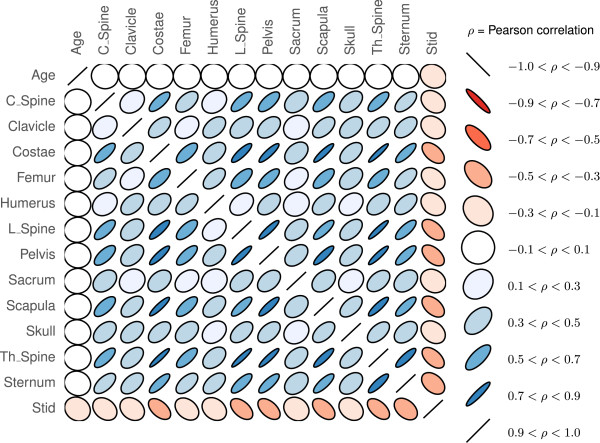
Figure 3.

Pearson’s correlation coefficients between all twelve BSI regions, age and survival time (Stid ). A red color indicates anti-correlation, while the size of the ellipsis indicates the strength of the correlation where −1≤ρ≤1 (zero indicates no linear correlation).
