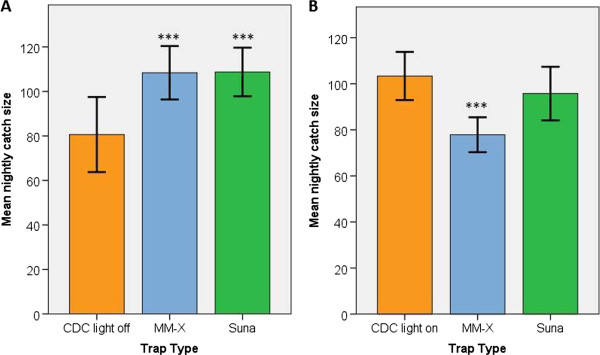
Figure 3.

Mean nightly catch sizes in the A: CDC LT (light off), MM-X trap and Suna trap, B: CDC LT (light on), MM-X trap and Suna trap during experiments in the MalariaSphere. (Error bars represent ± 2 SEM, N = 8 trap nights for each trap during each series of experiments, n = 200 female An. gambiae released during each experimental night). ***indicates P < 0.001 for a difference in catch size, relative to the CDC LT.
