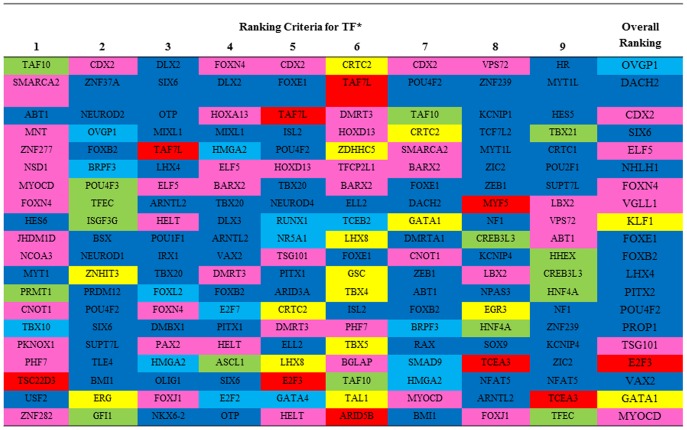
Figure 4. Relevant Transcription Factors (TF): Top 20 (for nominal 5% significance) transcription factors from the 364 included in the network according to nine criteria*.
Colors represent tissue of maximum expression: hypothalamus and (or) pituitary gland (dark blue), ovary (light blue), uterus and (or) Endometrium (pink), liver (green), longissimus dorsi muscle (red), adipose (yellow).*Ranking criteria are: 1) RIF1; 2) RIF2; 3) Overall differential expression; 4) Maximum differential expression (DE); 5) Connections in PRE-puberty network; 6) Connections in POST-puberty network; 7) Fold change in connections between PRE- and POST-puberty networks; 8) Network expansion ability in PRE-puberty; and 9) Network expansion ability in POST-puberty.

