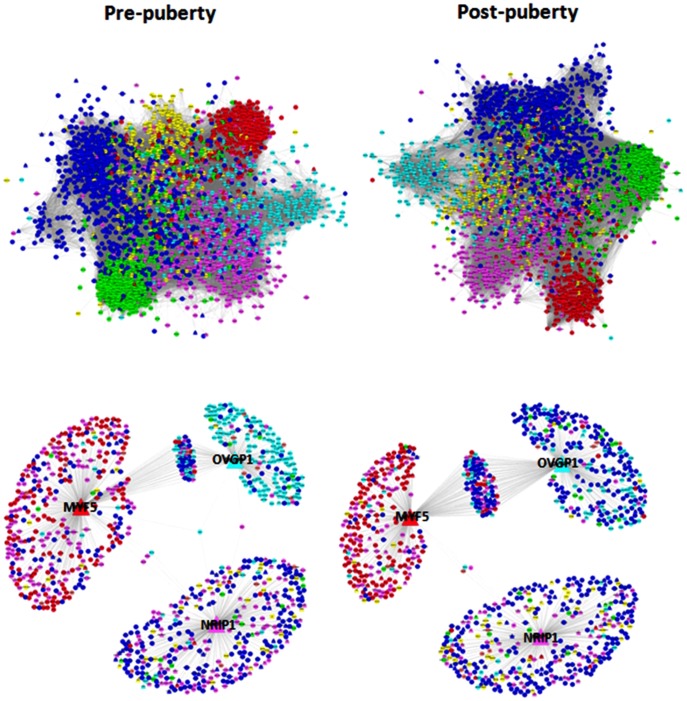
Figure 7. Gene co-expression networks constructed by combining results from RNA-Seq and GWAS with the knowledge of transcription regulators for pre-PRE (left panels) and post-pubertal (right panel) heifers.
Upper panels correspond to the visualization of the entire network comprising 2,450 nodes (or genes) while the lower panels correspond to the expansion of trio of TF comprised of OVGP1, NRIP1 and MYF5, defined as the best trio in terms of their ability to expand the majority of the topology of the entire networks. Colors represent tissue of maximum expression: hypothalamus and/or pituitary gland (dark blue), ovary (light blue), uterus and/or endometrium (pink), liver (green), longissimus dorsi muscle (red), adipose (yellow).

