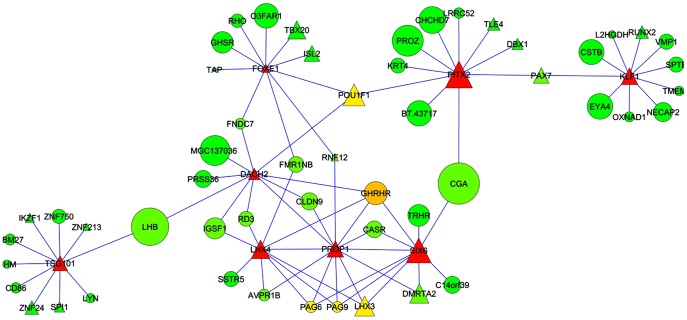
Figure 8. Sub-network created with highly co-expressed genes with significant hypothalamic and pituitary gland differential expression.
Triangles represent transcription factors. Color indicate connectivity degree from green (low connectivity) to yellow (medium connectivity) to red (high connectivity). Size indicates the relative amount of expression in the post-puberty sample.

