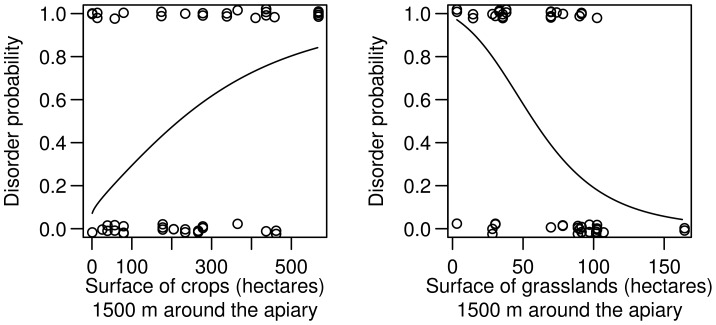
Figure 8. Probability of honeybee colony disorders depending on the apiary’s environment.
Consideration of crop surface vs. grassland surface in a radius of 1500 m around the apiary. Crops include fruit, vegetables, fodder production and horticulture. For each graph, the value of the variable not displayed is fixed to its observed mean (n = 53 colonies).

