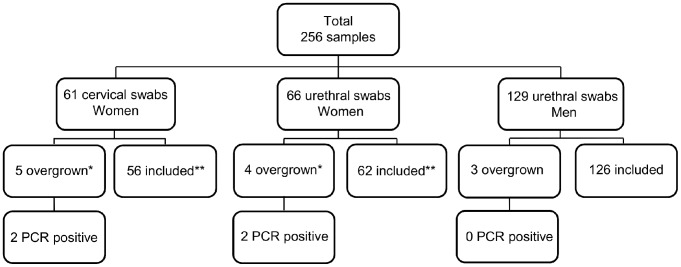
Figure 1. Flow-chart showing the distribution of samples included in the study.

* Four had a matching urethral- or cervical swab sample from the same woman which was also overgrown. One excluded cervical swab sample was not overgrown in the matching urethral swab. ** Fifty-five had a paired urethral- or cervical swab sample from the same woman.
