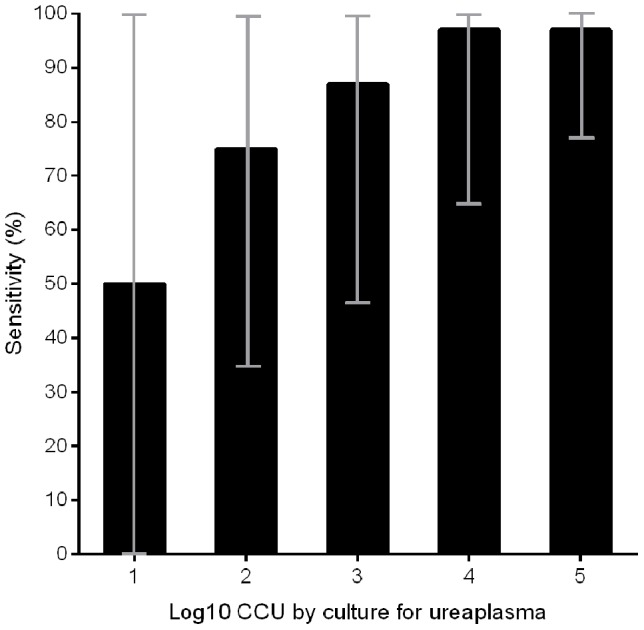
Figure 2. Bar-chart showing sensitivity in CCU group 1–5 for all sample types, male and female samples combined.

CCU 1–5: 1 positive of 2 (50%), 9 of 12 (75%), 13 of 15 (87%), 28 of 29 (97%) and 70 of 72 (97%), respectively. Confidence intervals (95%) are depicted as grey vertical lines.
