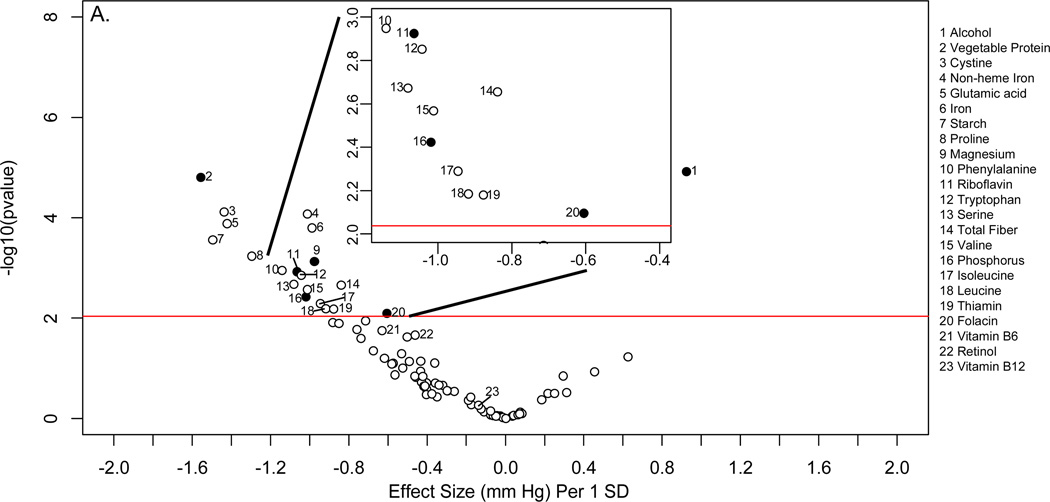
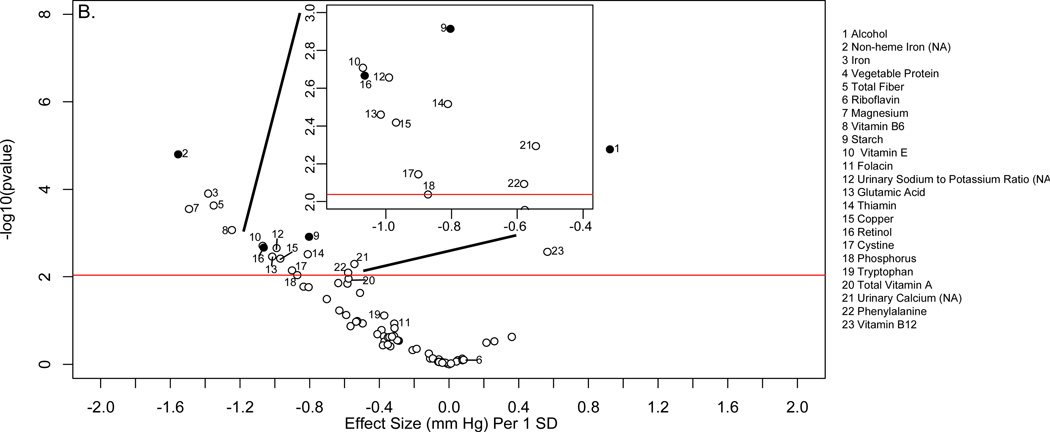
Figure 3.
“Volcano plot” graphic showing the nutrient-wide associations with diastolic blood pressure levels in INTERMAP training set for nutrient received from foods and urine excretion markers (A) and for nutrients received for foods and supplements (B) Y-axis indicates −log10(p-value) of the adjusted linear regression coefficient for each of the nutrients. Horizontal line represents the level of significance corresponding to FDR less than 5% and the x axis shows the effect sizes (mm Hg) per 1SD change in the nutrient variable. Filled marks represent tentatively validated nutrients in the INTERMAP testing set (p < 0.05). Analyses are adjusted for age, sex, reported special diet, use of dietary supplements, moderate or heavy physical activity (hours daily), doctor diagnosed cardiovascular disease or diabetes, family history of hypertension, height, weight and total energy intake.


