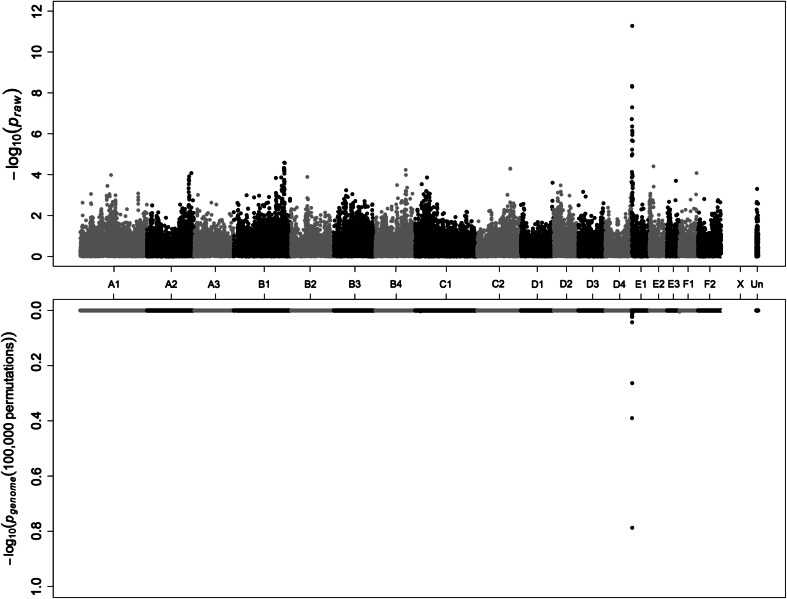
Fig. 2.
Genome-wide sib-TDT analysis of the Persian PRA. Upper plot represents the P raw values of the analysis, whereas the lower plot represents the genome-wide significant P genome values after 100,000 permutations. X-chromosome markers were removed in sib-TDT analysis. Significant association is localized to cat chromosome E1

