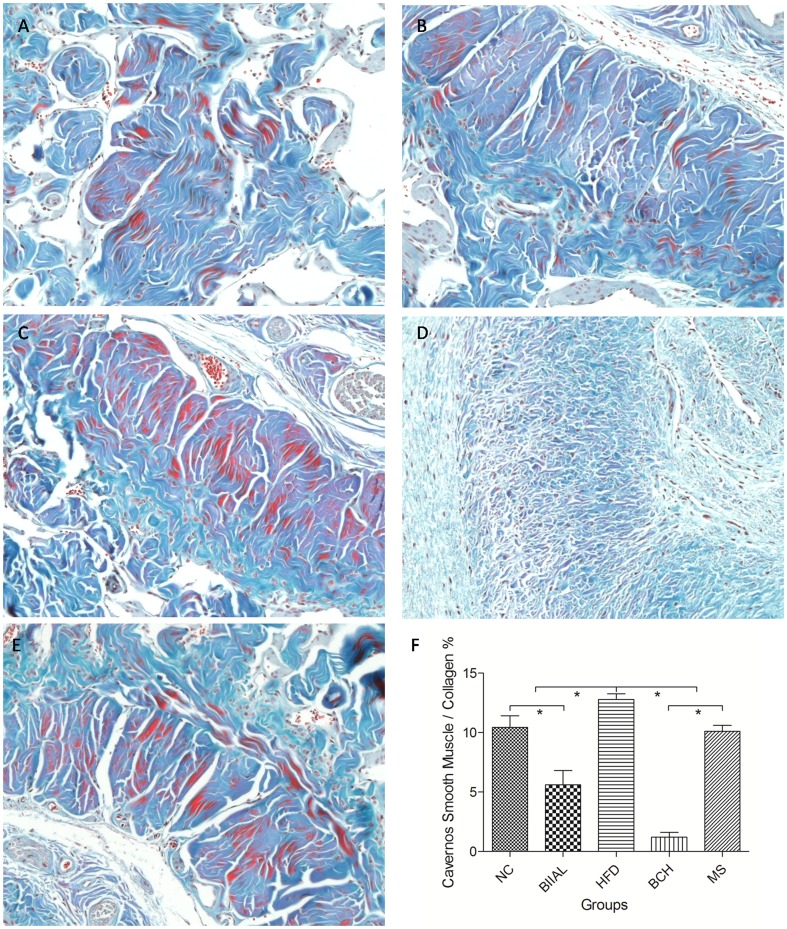
Figure 3. The Masson's trichrome staining of rat corpus cavernosum in NC, BIIAL, HFD, BCH and MS groups after 12 weeks.
Sections were made transversal to the penile axis. Masson's trichrome staining showed the changes in the cavernous smooth muscle and collagen in rat corpus cavernosum in the different groups. (A) Normal cavernous smooth muscle and collagen expression was observed in the NC group. (B) Moderately decreased cavernous smooth muscle and increased collagen expression was observed in the BIIAL group. (C) Significantly increased cavernous smooth muscle expression was observed in the HFD group. (D) Significantly increased collagen and decreased cavernous smooth muscle expression was observed in the BCH group. (E) Similar cavernous smooth muscle and collagen expression was observed in the MS and NC groups. (F) shows the quantitative analysis results of cavernous smooth muscle to collagen ratio in different groups (* p<0.05).

