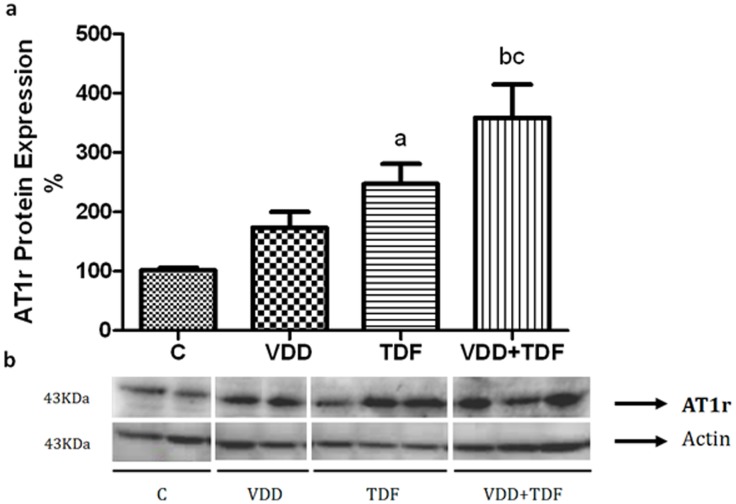
Figure 4. Semiquantitative immunoblotting of kidney fractions.
(a) A densitometric analysis of samples from control (n = 4), VDD (n = 6), TDF (n = 6) and VDD+TDF (n = 6) rats is shown. (b) Immunoblots reacted with anti-AT1 revealing a 43-kDa band. Values are means ± SEM. ap<0.05 vs. C; bp<0.01 vs. C and cp<0.05 vs. TDF.

