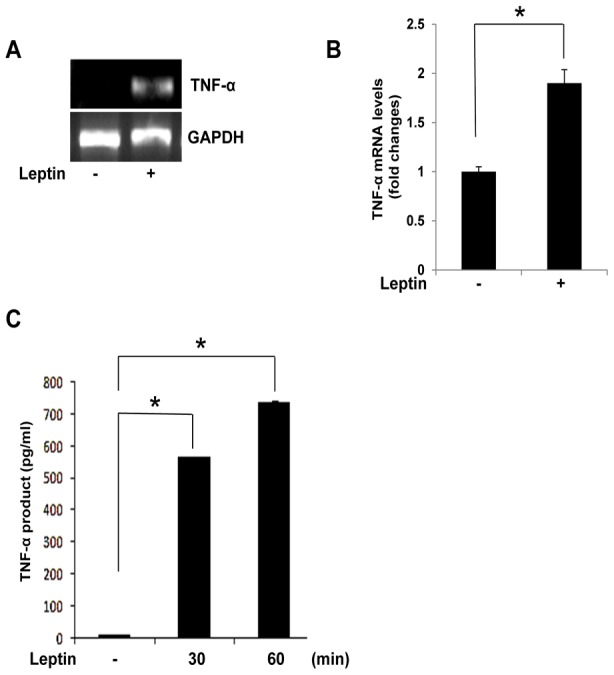
Figure 1. Effect of leptin on TNF-α expression in Raw 264.7 cells.

(A,B) Raw 264.7 cells were treated with leptin (20 nM) for 30 min. Total RNA was isolated using TRIzol reagent, and mRNA levels were determined by semi-quantitative and real-time RT-PCR with primers for TNF-α or GAPDH. *p<0.05 vs control. (C) For ELISA, cells in 96-well culture plates were treated with leptin (20 nM) for the indicated times. Results are the mean ± S.E. for each group of samples. Data are means ± S.E. of eight values. *p<0.05 vs control.
