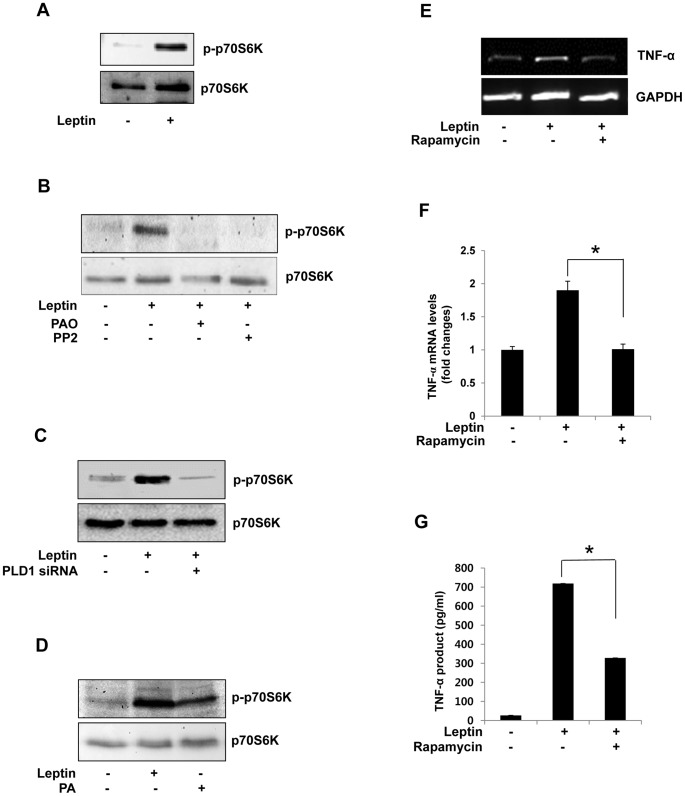
Figure 4. Involvement of p70S6K in leptin-induced TNF-α expression in Raw 264.7 cells.
(A) Cells were treated with leptin (20 nM) for 5 min and then harvested, and the amounts of total p70S6K and p-p70S6K were determined by Western blotting. (B) Cells were pretreated with PAO or PP2 (20 µM) for 30 min and then treated with leptin as above. (C) Cells were transiently transfected with 200 nM PLD1 siRNA for 48 h and stimulated with leptin (20 nM) for 30 min. Cell lysates were analyzed as above. (D) Cells were treated with PA (10 µM) for 1 h, and cell lysates were analyzed as above. (E,F) Cells were pretreated with rapamycin (50 µM) for 30 min and then stimulated with leptin (20 nM) for 30 min. Total RNA was isolated using TRIzol reagent, and mRNA levels were determined by semi-quantitative and real-time RT-PCR with primers for TNF-α or GAPDH. *p<0.05 vs leptin-treated control (G) Cells in 96-well culture plates were pretreated with rapamycin (100 nM) for 30 min and then stimulated with leptin (20 nM) for 1 h. Results are the mean ± S.E. amounts of TNF-α measured by ELISA for each group of samples. Data are means ± S.E. of eight values. *p<0.05 vs leptin-treated control.

