
Figure 2. Haplotype networks of Culex pipiens and Culex torrentium for the cox1 gene segment calculated using statistical parsimony as implemented in TCS 1.21.
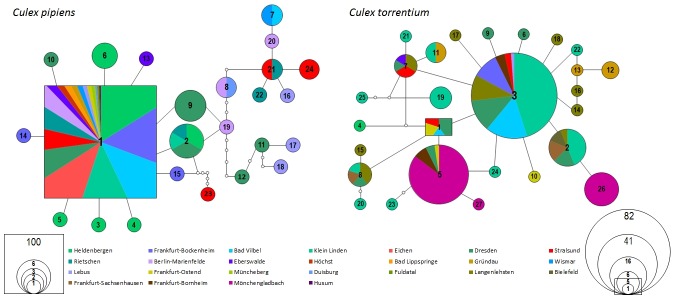
The squares stand for the most probable ancestral haplotypes, the circle for all other haplotypes. The Numbers are equal to the haplotypes of each species. Each line represents a single mutation while small white dots symbolize hypothetical missing haplotypes. The size of the circles and the square is proportional to the number of the occurring haplotypes. The number of individuals can be derived from the scale which is given in the figure. Different colors represent the different geographical sampling localities. The colored area is proportional to the occurrence at the respective site.