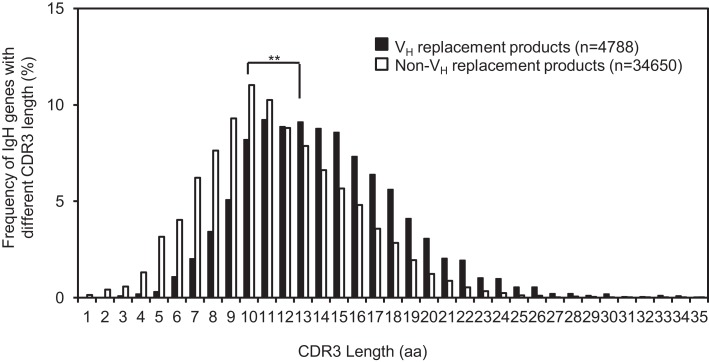
Figure 4.
The average CDR3 length of identified VH replacement products is significantly longer than that of non-VH replacement products. The distribution of IgH genes with different CDR3 lengths is shown in the bar graph. The average CDR3 length of VH replacement products (black bars) was compared to that of non-VH replacement products (white bars). Statistical significance was determined by using an unpaired t-test. **p < 0.0001 is considered extremely statistically significant.

