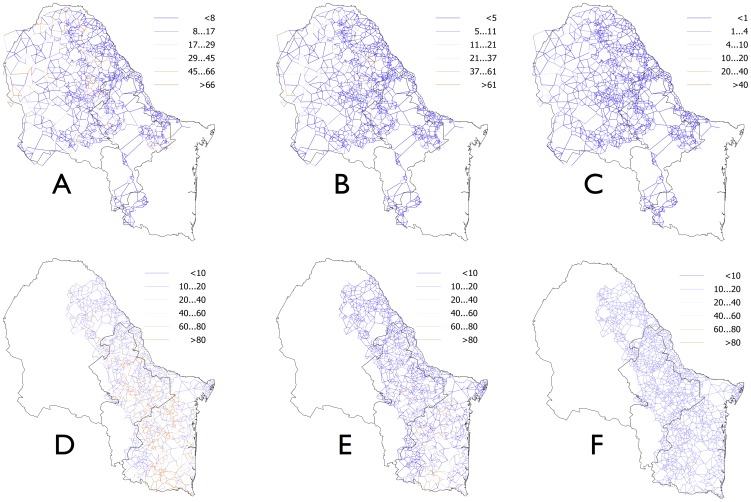
Figure 3. Effect of WTD vaccination on tick infestations.
(A–C) Changes in the recruitment rates of R. annulatus in the study area each year after three years of WTD vaccination at the day 50 every year. (D–F) Changes in the recruitment rates of R. microplus in the study area each year after three years of WTD vaccination at the day 50 every year. Each line shows the link between two contiguous patches forming the network of movements of hosts and ticks across the study area. Different colors represent individual recruitment levels, a value indicating density of ticks. Higher values indicate higher number of ticks moving between patches.

