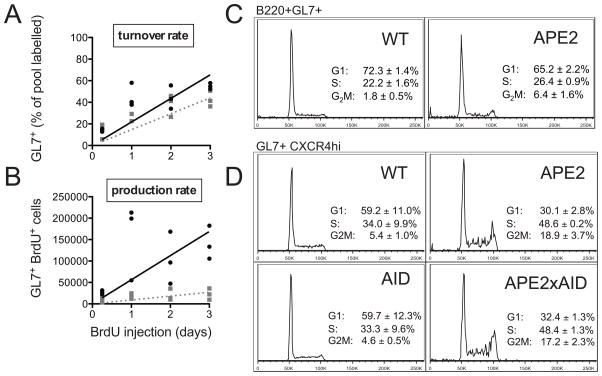
Figure 5. Proliferation and cell cycle profile of APE2-deficient GC cells.
(A,B) Incorporation of BrdU into GC B cells was determined by flow cytometry in WT (black circles) and APE2-deficient (gray squares) mice injected with BrdU every 12h for 3d (n=3 for each time point). (A) The percent of the GL7+ cells that are BrdU+ (turnover rate) and (B) the total number recovered per mouse (production rate) is shown. (C) Representative propidium iodide stain for DNA content of PP cells gated on B220+GL7+ cells shows slight G2/M block in APE2-deficient GC cells (mean ± SEM, n=3, p<0.05 for each cell cycle phase). (D) Representative cell cycle profile of PP B220+GL7+CXCR4HI cells from mice of the indicated genotypes (n=3).

