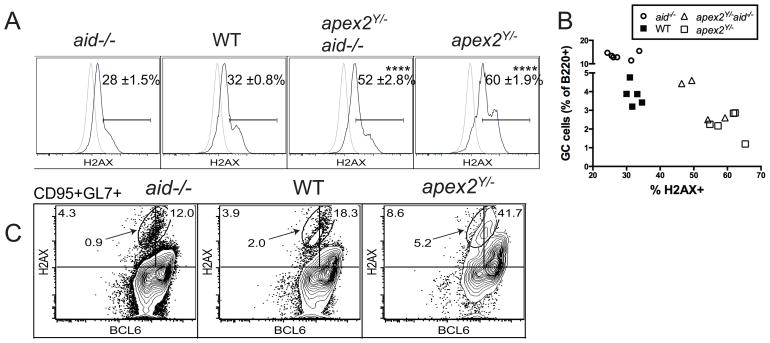
Figure 6. DNA damage is associated with decreased BCL6 and GL7 expression.
(A) γ-H2AX staining for DSBs by flow cytometry in PP GC cells (black line) and WT non-GC control B cells (gray line). (B) Data from (A) plotted vs. GL7+ cells as percent of B220+ PP cells. (C) BCL6 and γ-H2AX intracellular staining in B220+CD95+GL7+ PP cells. Gates are set so that non-GC cells are ≤ 1% positive for H2AX or BCL6. Plots are representative of 3 or more independent experiments and gate frequencies shown are representative (C) or the mean ± SEM (A); n = 4 WT, 4 apex2Y/−, 5 aid−/− and 3 apex2Y/−aid−/− mice; ****p<0.0001, one-way ANOVA with Tukey’s multiple comparison test.

