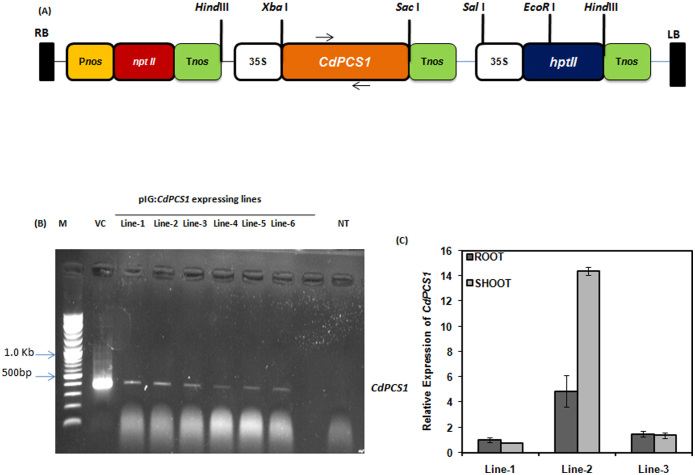
Figure 1. Plasmid map of pIG121-CdPCS1 and molecular analysis of CdPCS1 expressing rice transgenic lines.
(A) Plasmid map of pIG121-CdPCS1. Horizontal arrows above the CdPCS1 gene in the plasmid represents the region selected for PCR amplification. (B) Confirmation of the presence of CdPCS1 in transgenic lines through genomic DNA PCR. Lane-M represent O' Range RulerTM 100 bp + 500 bp DNA ladder, VC represent vector control and NT represents non transgenic control. PCR amplification was carried out using gene-specific CdPCS1-RTF and CdPCS1-RTR primers. Full-length gel is presented in Figure S3. (C) Relative expression analysis of CdPCS1 in root and shoot of CdPCS1 transgenic lines through qRT-PCR analysis by normalizing to the actin level as a control. Data are shown as mean ± SD of 3 independent experiments.

