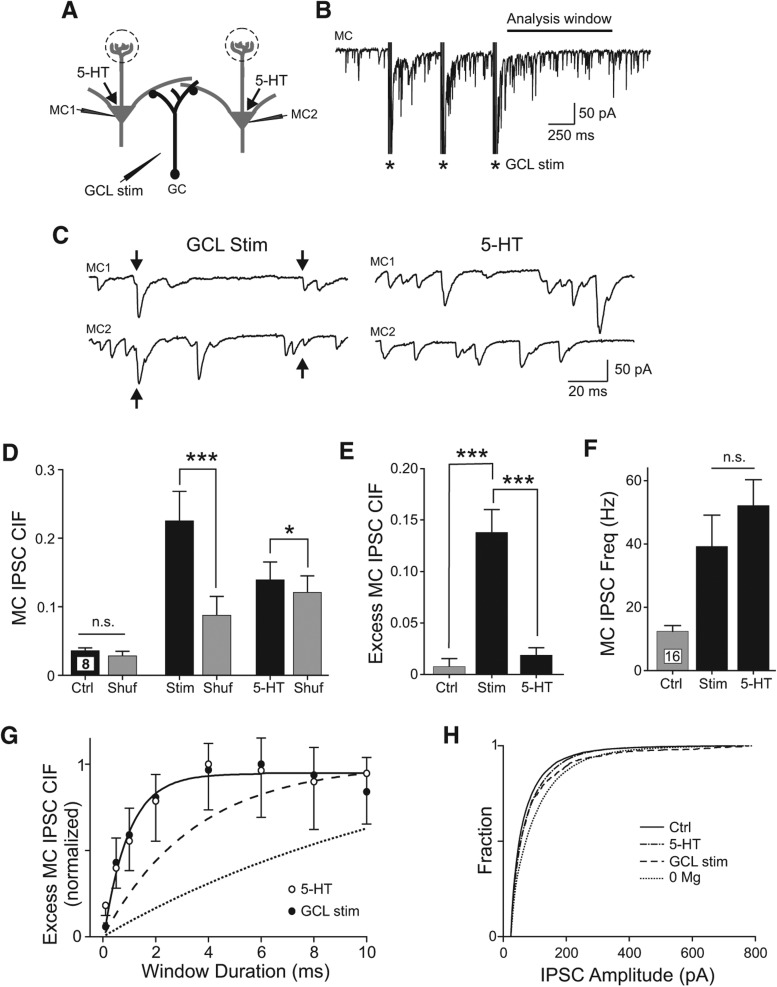
Figure 6.
Synchronous MC inhibition triggered by afferent stimulation. (A) Diagram of recording configuration. (B) Example recording of MC response to tetanic stimulation in GCL (three bursts of four shocks at 100 Hz, 500-msec inter-burst interval). (C) Enlargements of responses to GCL stimulation (left traces, arrows indicate IPSCs with onset latencies that differed by <0.2 msec) in a paired MC recording with coincident inhibition. Bath application of 5-HT failed to evoke synchronous inhibition in the same pair of MCs (right traces). (D) Plot of the synchronous MC inhibition (IPSC CIF) present in control (Ctrl) conditions, following bath application of 5-HT, and following GCL stimulation (Stim). Estimates of IPSC synchrony expected by chance in each condition presented in gray columns (Shuf). (*) P < 0.05, (***) P < 0.005, n.s., P > 0.05, paired t-test. (E) Plot of excess CIF (Actual CIF–CIF expected by chance) in control conditions, 5-HT, and following GCL stimulation. (***) P < 0.005, paired t-test. (F) Plot of increase in IPSC frequency in 5-HT and following GCL stimulation. Both conditions increased IPSC rate from control conditions (P < 0.005, paired t-test). IPSC frequency did not differ significantly between 5-HT and GCL stimulation conditions (P > 0.05, n.s., paired t-test). (G) Plot of relationship between excess MC IPSC CIF and the duration of the sliding analysis window in both 5-HT (open symbols; mean ± SEM, downward error bars) and following GCL stimulation (filled symbols; upward error bars). Solid line represents single divergent interneuron model with 2.0 ± 0.5-msec (mean ± SD) jitter associated with GABA release events. Dashed and dotted lines represent models of coincident IPSCs arising from excitatory synchronization of multiple interneurons. See Materials and Methods for details. (H) Plot of the cumulative IPSC amplitude distributions for control conditions (solid line, n = 20 cells), 5-HT (dash–dot line, n = 20), 0 Mg2+ ACSF (dotted line, n = 8), and following GCL stimulation (dashed line, n = 16).

