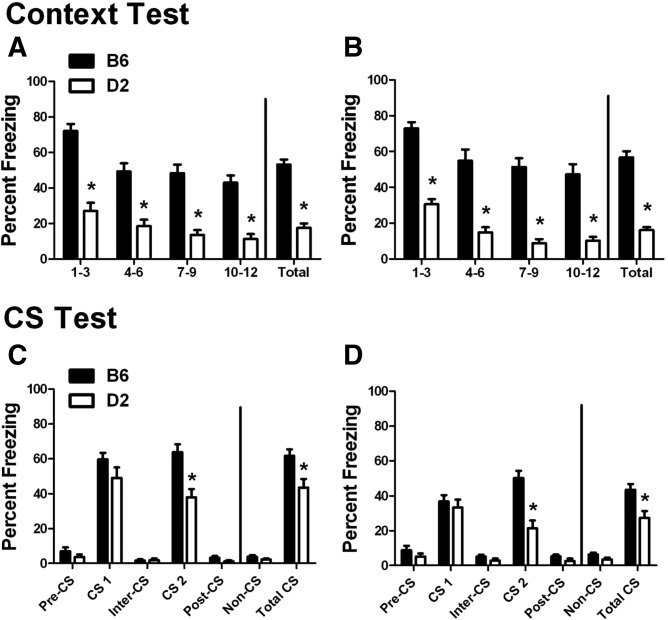
Figure 2.
Context and CS tests. Percent freezing (mean ± SEM) during the context and CS tests. (A,B) Freezing to the context is presented in 3-min bins and as the total for the 12-min test in (A) delay- and (B) trace-trained mice. (C,D) Freezing to the CS is presented in 3-min bins corresponding to the individual periods of the test and as the total freezing for the non-CS (pre-CS, inter-CS, and post-CS) and CS (CS 1 and CS 2) periods for (C) delay- and (D) trace-trained mice. (*) P < 0.05 for B6 versus D2.

