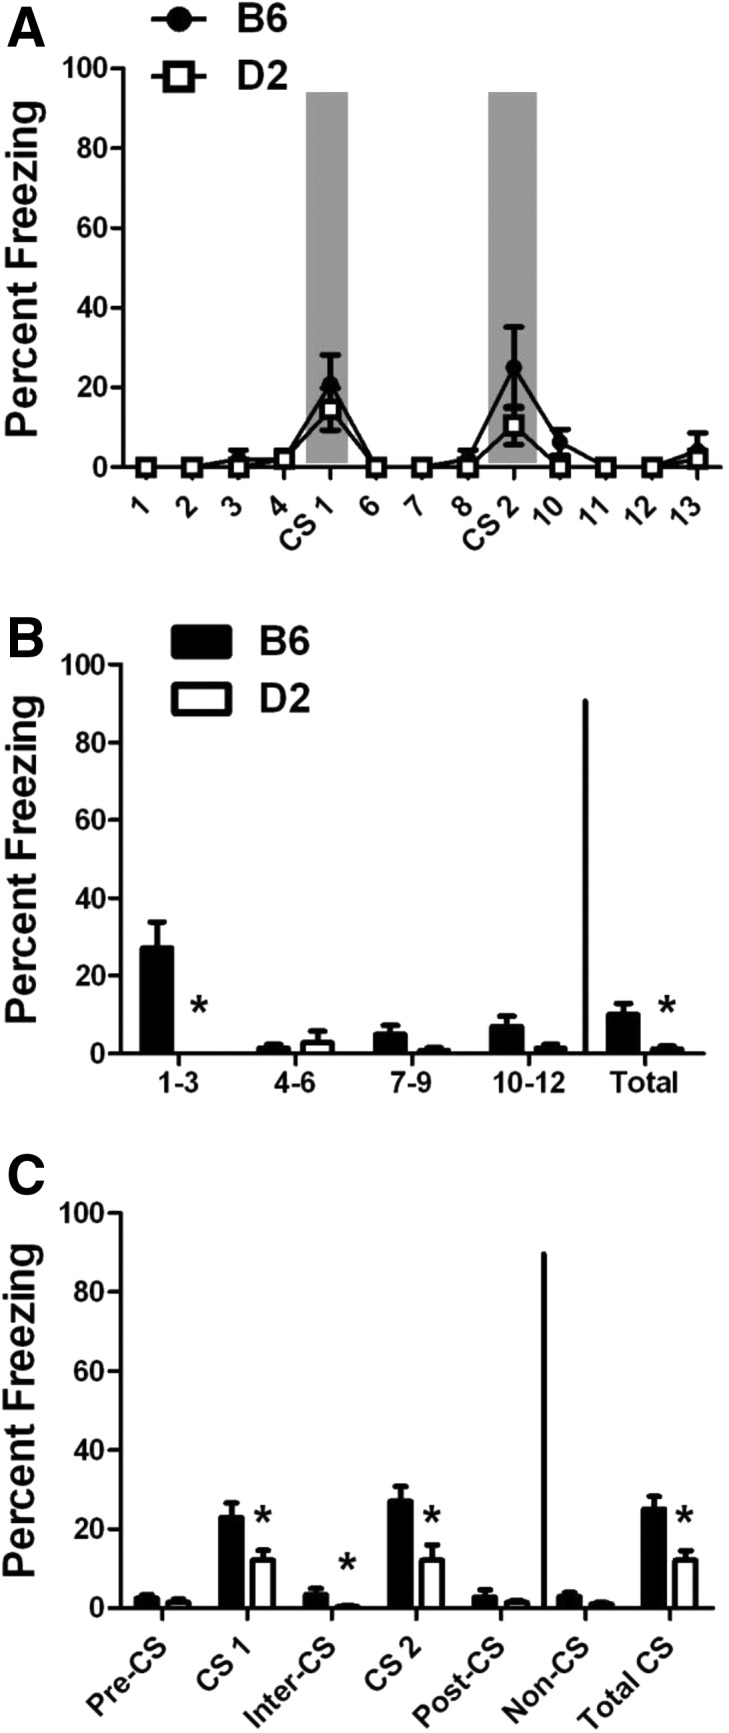
Figure 4.

No-US training, context test, and CS test. Percent freezing (mean ± SEM) for mice trained in the absence of a US. (A) Training: freezing during the No-US training procedure is shown in 30-sec bins to match the CS duration. The CS was presented twice with the same timing as the delay and trace training paradigms (gray bars). (B) Context test: freezing is presented in 3-min bins along with the total freezing for the entire 12-min period. (C) CS test: data are shown in 3-min bins to match the intervals of the CS test. Total freezing during the non-CS and CS intervals is also shown. (*) P < 0.05 for B6 versus D2.
