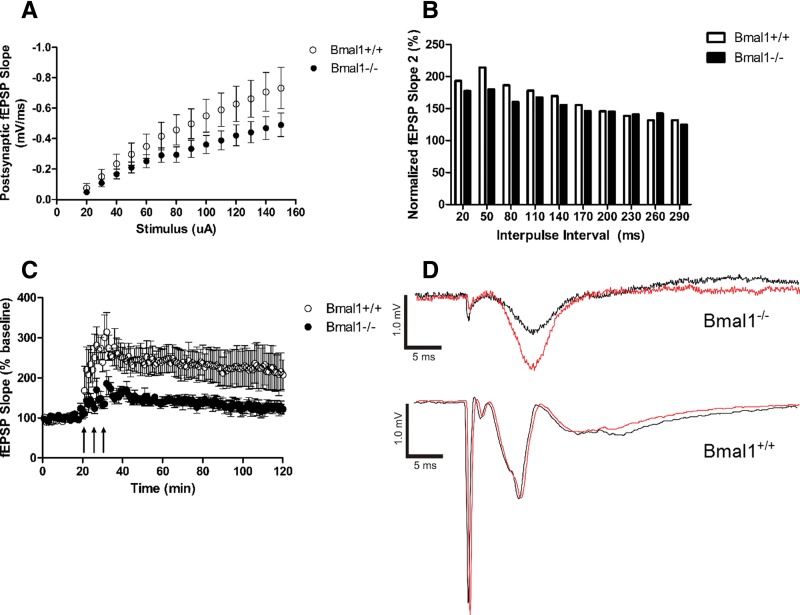
Figure 3.
LTP at the Schaffer-collateral synapse is impaired in the Bmal1−/− hippocampus. (A) Input/output (I/O) relationship between stimulus (µA) and the slope of the postsynaptic evoked fEPSP (mV/ms). Stimulus ranged from 20 to 150 µA. There is no difference between the Bmal1+/+ and Bmal1−/− I/O values at each stimulus. Tukey's multiple comparison test. n = 10–12. (B) Paired-pulse facilitation with interpulse interval ranging from 20 to 290 msec. There was no difference between the normalized slopes of the second fEPSP at each interpulse interval. Tukey's multiple comparison test. n = 7–9. (C) Averaged LTP response of the Schaffer-collateral fibers, represented by fEPSP slope and normalized to pretetanic baseline. To induce LTP, three tetanic stimuli (1-sec, 100-Hz train with 0.1-msec pulse length) separated by 5 min were delivered. Bmal1−/− hippocampus demonstrated significantly reduced LTP with a mean fEPSP slope response within first 30 min following induction (U = 0.0, P < 0.0001, r = 1.21, Mann–Whitney). The Bmal1−/− hippocampus continued to demonstrate a significantly reduced response 60–90 min following induction (U = 0.0, P < 0.0001, r = 1.22, Mann–Whitney). (D) Representative LTP traces from individual slices. Black is 5 min after tetanic stimulations. Red is 60 min after tetanic stimulations. All values represent mean ± SEM.

