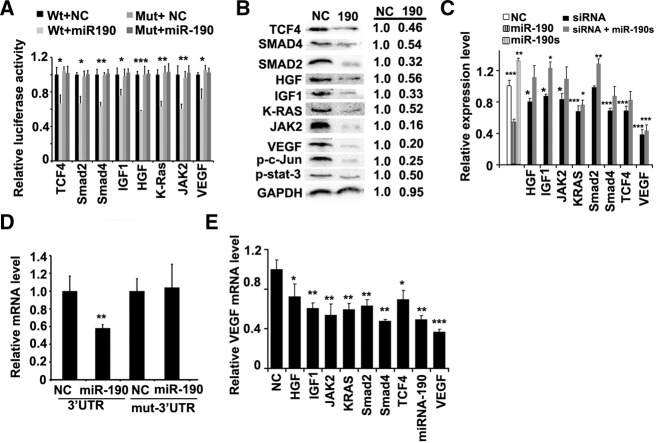
FIGURE 4.
miR-190 regulates a group of target genes centralizing VEGF. (A) Luciferase activity in the 293T cells upon transfection with different reporter constructs as indicated. NC stands for an empty vector. N = 3. (*) P < 0.05, (**) P < 0.01, (***) P < 0.005 (t-test). (B) Immunoblots for endogenous TCF4, Smad2, Smad4, RAS2, Jak2, HGF, IGF1, VEGF, phosphorylated c-Jun, or phosphorylated Stat3 in the indicated HCT116 cells. Representative images are shown at left and the average value for each gene is calculated at right (N = 4). GAPDH was used as the loading control. (C) ELISA assay of secreted VEGF in HCT116 cells as indicated. N = 3. (*) P < 0.05, (**) P < 0.01, (***) P < 0.005 (t-test). (D) Relative mRNA levels of luciferase reporters containing VEGF 3′ UTR or mutant 3′ UTR in HCT116 cells infected as indicated by real-time PCR. GAPDH was used as the loading control in real-time PCR assay. N = 3. (**) P < 0.01 (t-test). (E) Relative VEGF mRNA levels in HCT116 cells infected as indicated by the real-time PCR. GAPDH was used as the loading control in real-time PCR assay. N = 3. (*) P < 0.05, (**) P < 0.01, (***) P < 0.005 (t-test).

