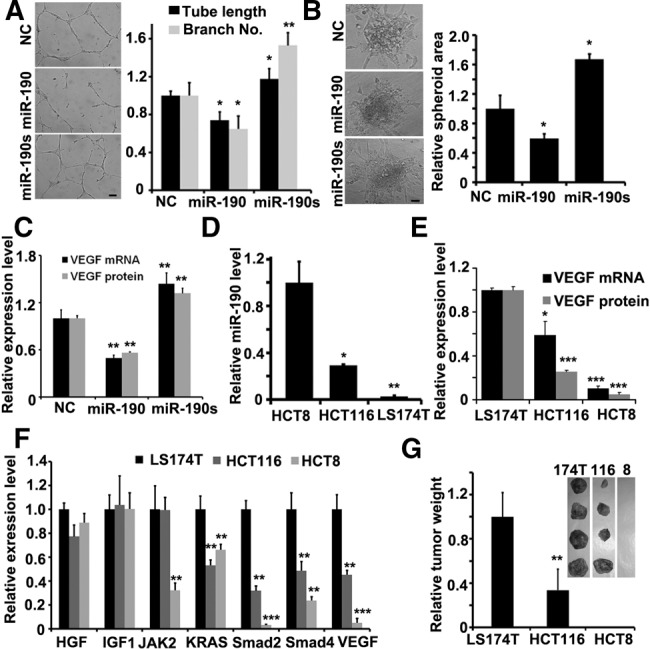
FIGURE 5.

miR-190 inhibits the tumor microenvironment angiogenesis. (A) Tubule formation of HUVECs treated with supernatant as indicated. Shown is a representative image at 24 h after plating. Quantitation of tubule branching and tubule length. N = 5. (*) P < 0.05, (**) P < 0.01 (t-test). Scale bar, 50 μm. (B) Spheroid-based angiogenesis assay of HUVECs treated with supernatant as indicated. Quantitation of cumulative length of the sprouts. N = 10. (*) P < 0.05 (t-test). Scale bar, 50 μm. (C) Expression of VEGF in HCT116 cells transfected with different vectors as indicated by real-time PCR or ELISA assay. N = 3. (**) P < 0.01 (t-test). (D) Expression of miR-190 in different colon cancer cell lines as indicated by real-time PCR. N = 3. (*) P < 0.05, (**) P < 0.01 (t-test). (E) Expression of VEGF mRNA or secreted protein in different colon cancer cell lines as indicated by real-time PCR or ELISA assay. N = 3. (*) P < 0.05, (***) P < 0.005 (t-test). (F) The mRNA level of HGF, IGF1, Jak2, KRAS, Smad2, Smad4, or VEGF in HCT116, HCT8, and LS174T cell lines. (G) Images of tumors formed by different colon cancer cell lines as indicated harvested from nude mice. No solid tumor found in nude mice after injection of HCT8 cells. Quantification of tumor weight. N = 4. (**) P < 0.01 (t-test).
